- The Economy Tracker
- Posts
- The Recession Phase Has Officially Arrived
The Recession Phase Has Officially Arrived
And the Markets are Signaling That They Agree
Nick Tomas
April 04, 2026 • Estimated Reading Time: 7 minutes
Table of Contents
The Economy Tracker: Entering the Recession Phase
The wait for late-reported data from the record-breaking government shutdown is over. The results confirm what we’ve been tracking: the economy is continuing to slow, and the beginning of the end of current credit cycle has arrived.
As of January 1, 2026, the US economy has officially entered the Recession Phase of the Credit Cycle.
This does not mean that the official recession is here yet necessarily, although if could be. Keep in mind that The Economy Tracker is built to be an indicator, so it enters each phase before it is felt/experienced on the ground.
Think of this as a Recession Watch. Much like a tornado watch, it doesn’t mean the storm has hit your town yet. It means the atmospheric conditions are ripe for one. By the time a "Watch" is upgraded to a "Warning," it is often too late to prepare. Now is the time to check your "storm shutters" before conditions deteriorate further.
What the Markets are Telling Us
The market is currently confirming as it is in a "risk-off" environment. This is the financial version of investors moving their money from the playground to the vault. We are seeing three specific signals:
Volatile, whippy stock action ✅
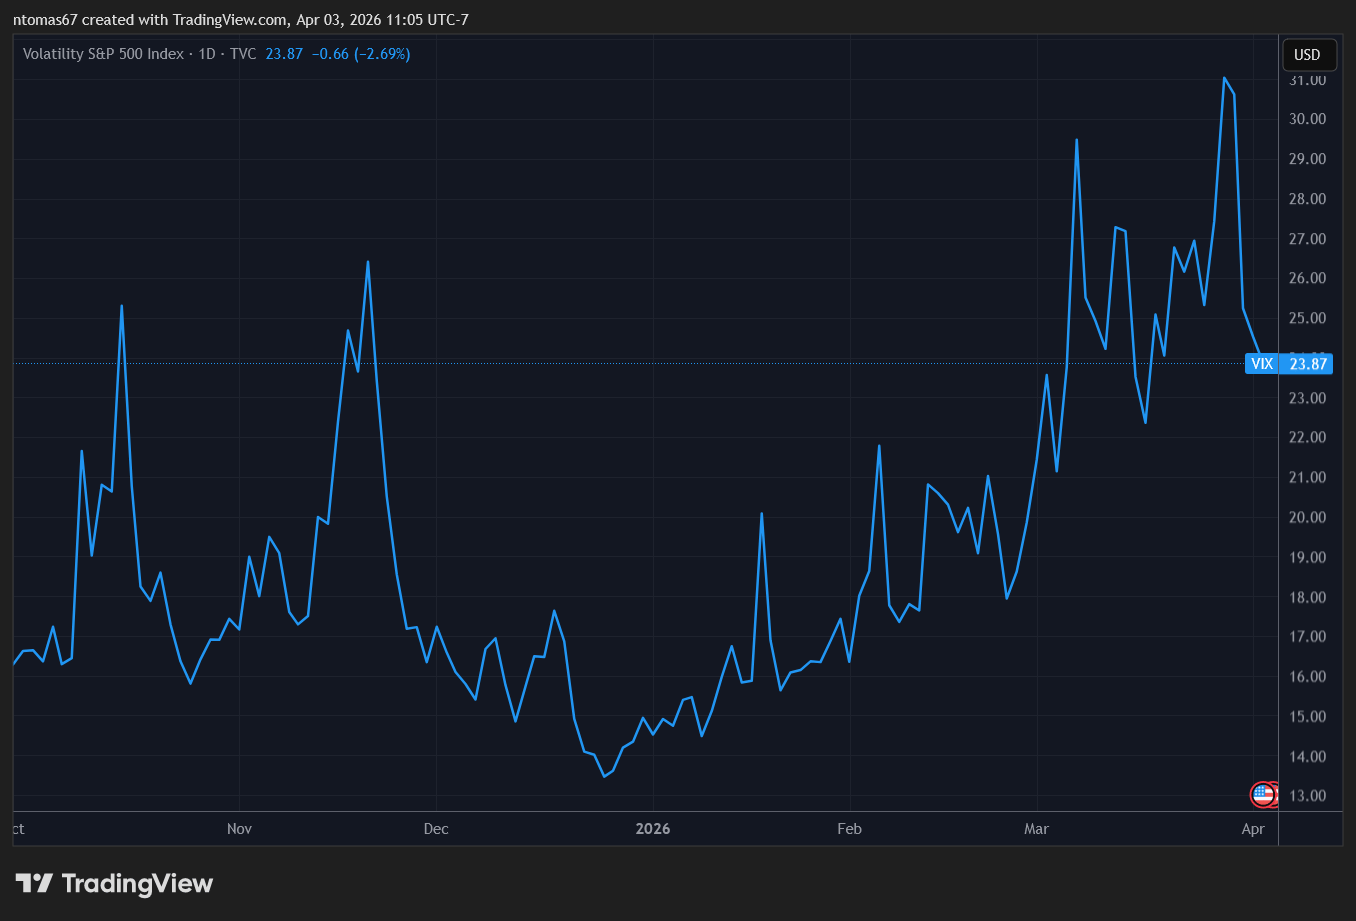
Volatility Index - Last 6 Months
Poor overall stock returns ✅

Flight to Safety ✅
Investors are rotating out of "growth" stocks and into "defensive" assets.

A trend that actually began the prior quarter.

Late-Cycle Leadership: The sectors currently leading the market are those people need, not those they want. ✅
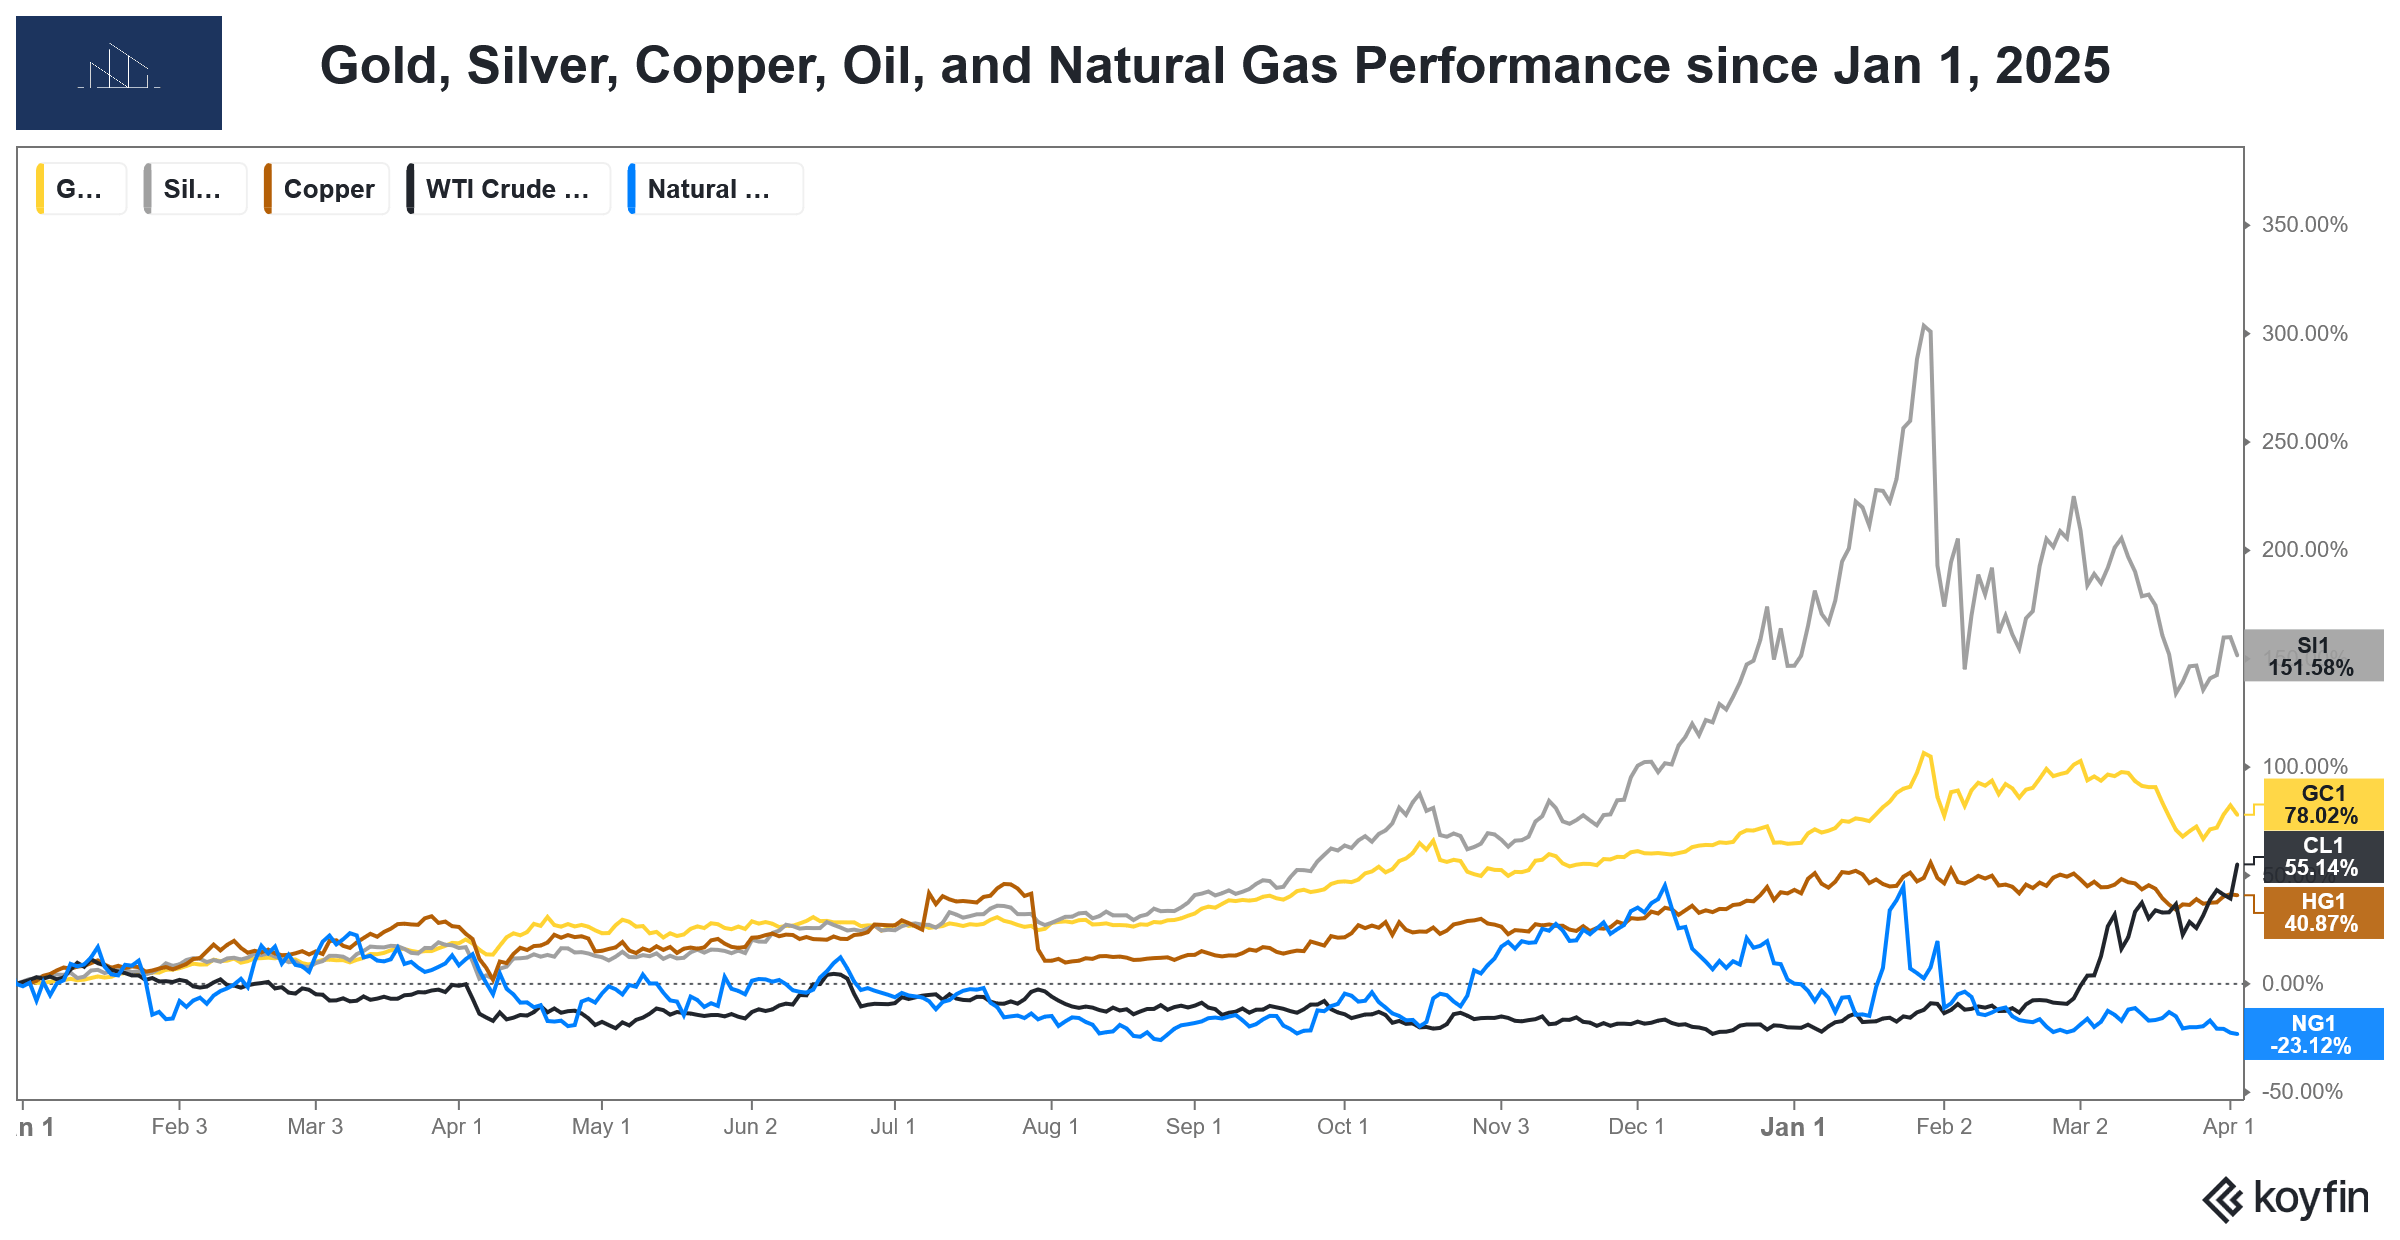
Late-cycle leaders like Utilities $XLU ( ▲ 0.77% ) , Consumer Staples $XLP ( ▲ 0.59% ) , Energy $XLE ( ▲ 3.16% ) , and Materials $XLB ( ▼ 0.77% ) are showing relative strength. Exactly what you would expect for an economy that has moved past its peak.

Q1 Top 5 Sectors: 1) Energy 2) Materials 3) Utilities 4) Consumer Staples 5) Industrials
This is also a continuation of what began the previous quarter.

6-Month Top 5 Sectors: 1) Energy 2) Materials 3) Consumer Staples 4) Industrials 5) Utilities
The "Stress Signals" Under the Surface
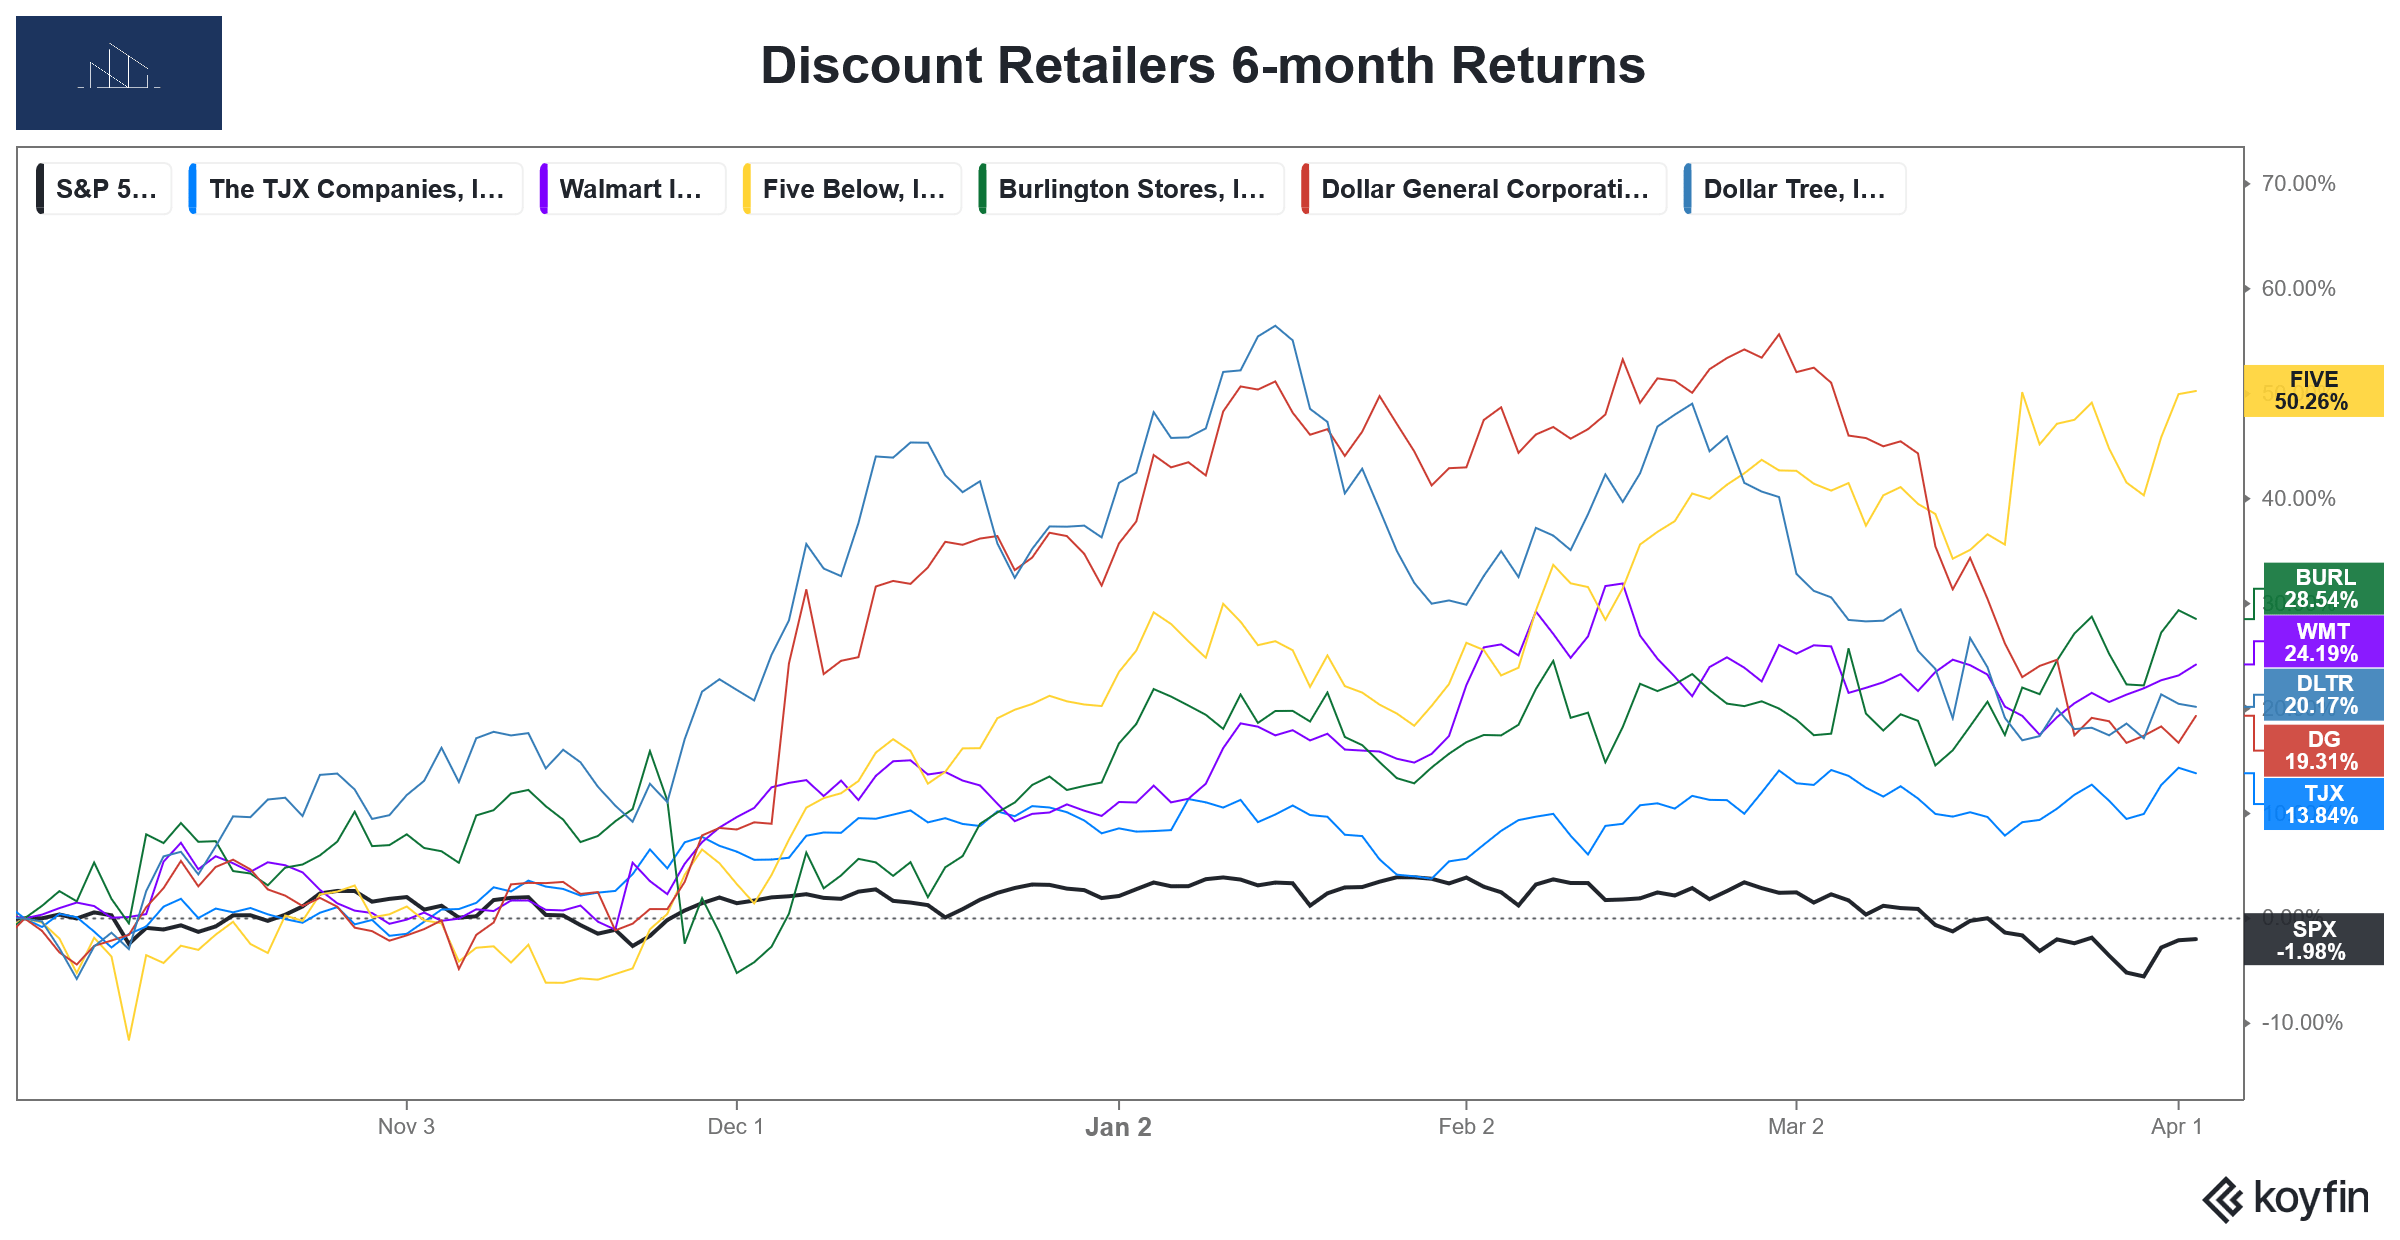
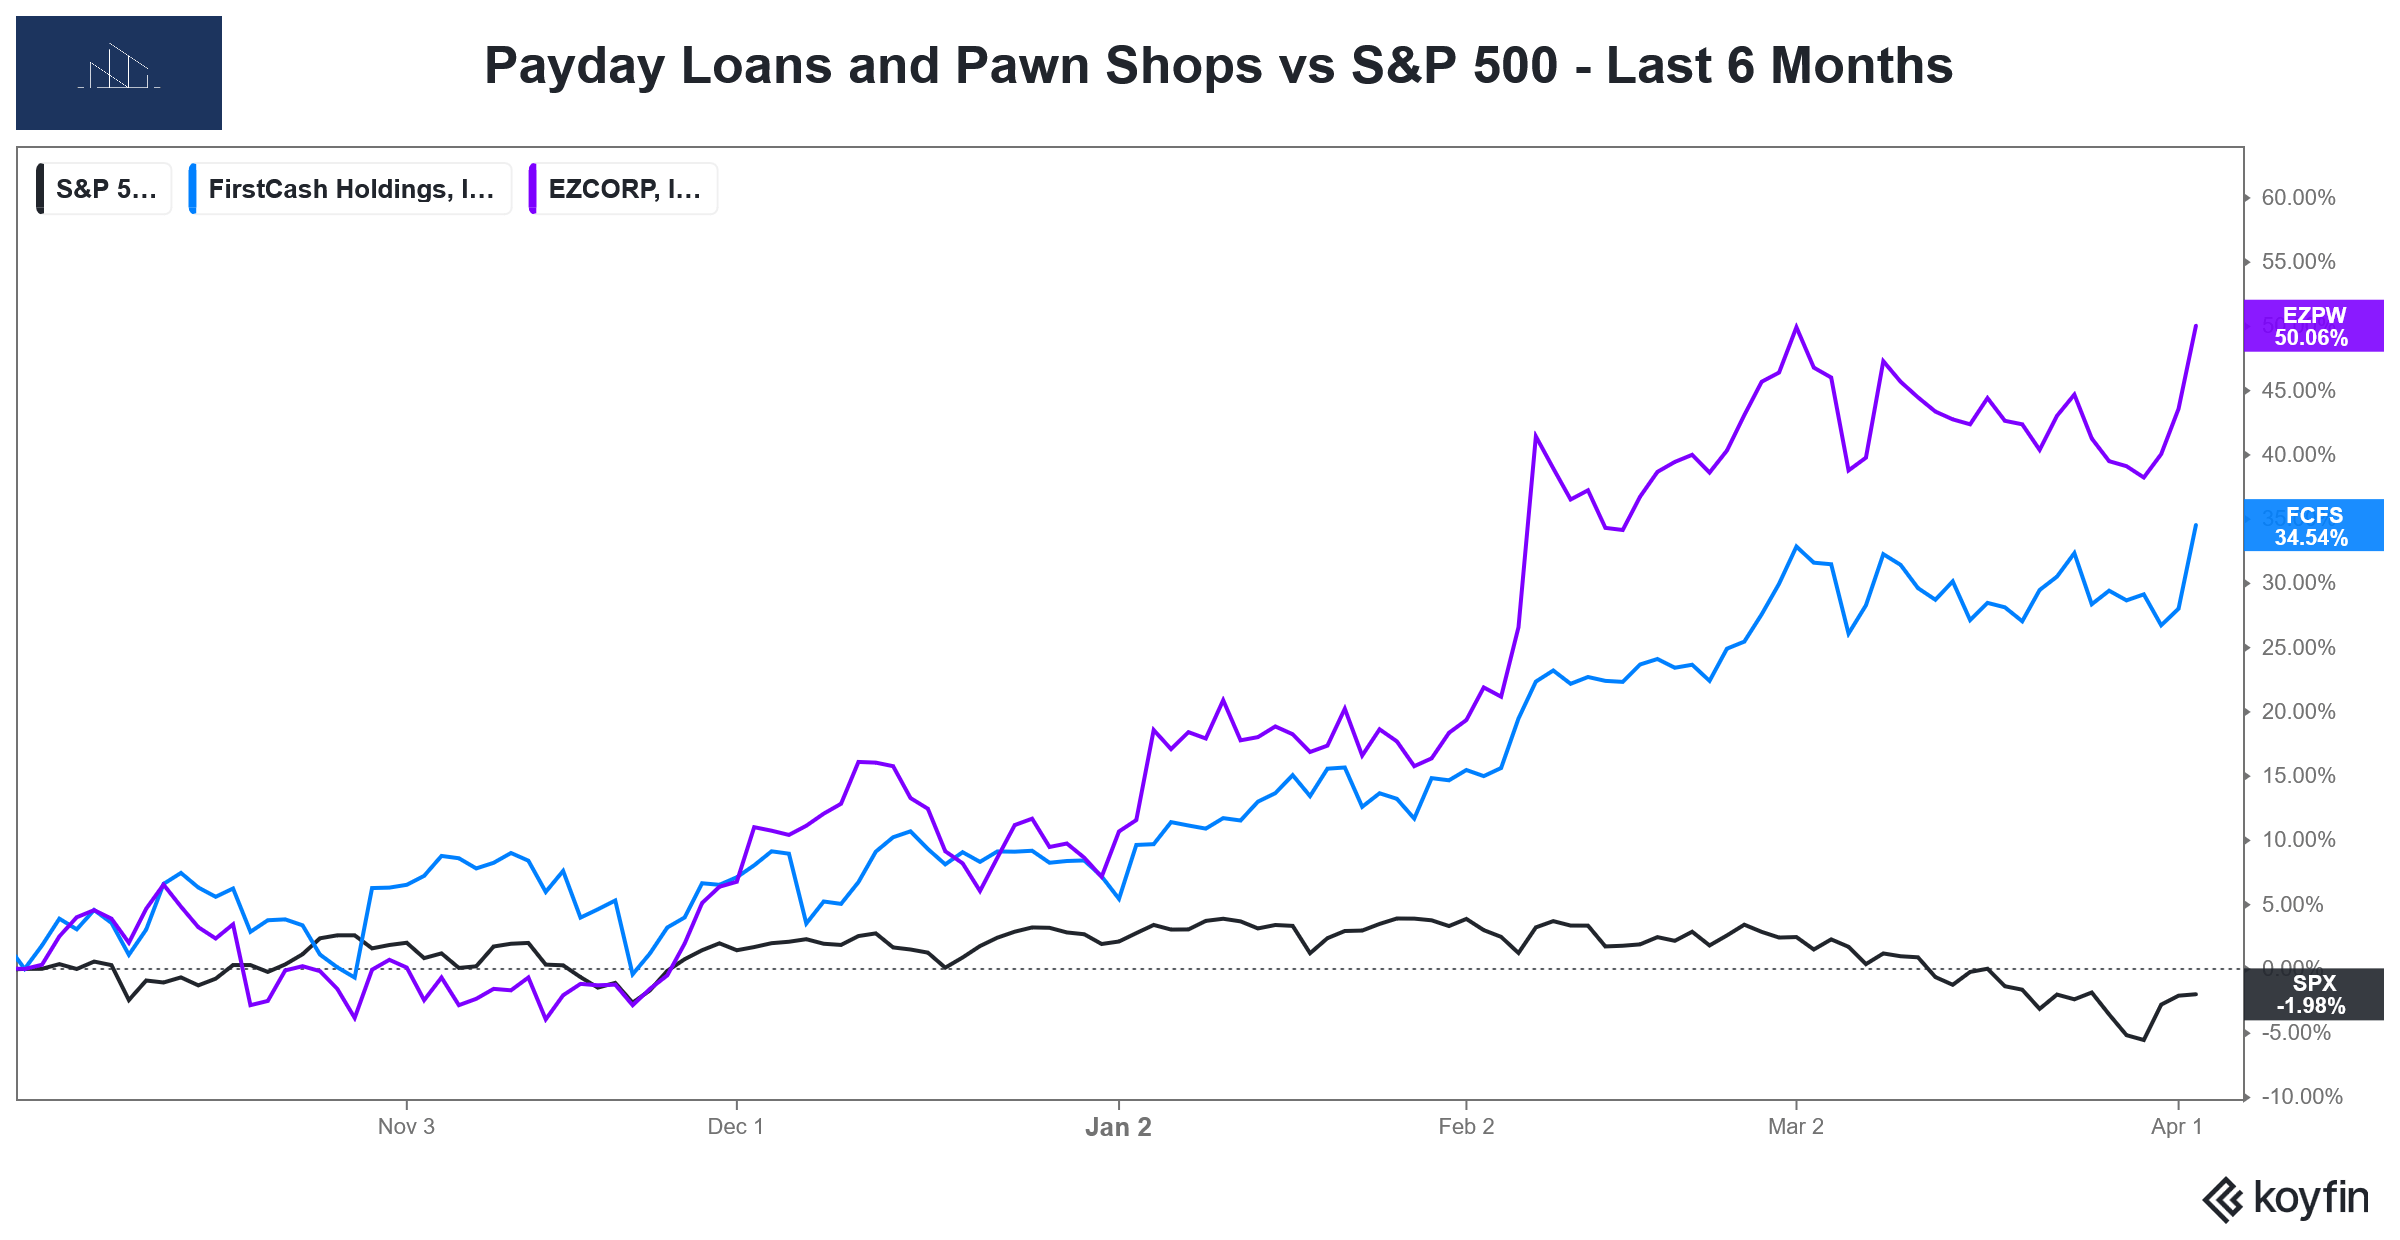
Beyond the stock market, real-world data shows that household budgets are being squeezed. We are seeing "relative strength" in businesses that thrive when people are struggling: Discount Retailers, Pawn Shops, and Payday Lenders.
Trading Down: When discount stores outperform, it means families are swapping name brands for generics to make ends meet. This is often the result of their budgets getting squeezed by a weaker economy, higher inflation, and/or rising debt servicing costs.
Liquidity Desperation: Growth in pawn shop and payday loan activity signals that lower-income households are using high-cost debt just to cover basic survival expenses. This acts as a stress signal that household balance sheets, especially for lower-income and subprime borrowers, are deteriorating. Which is consistent with rising financial strain and an economy that is weakening beneath the surface.
Hard Data: Some of the Places where the Strain is Showing
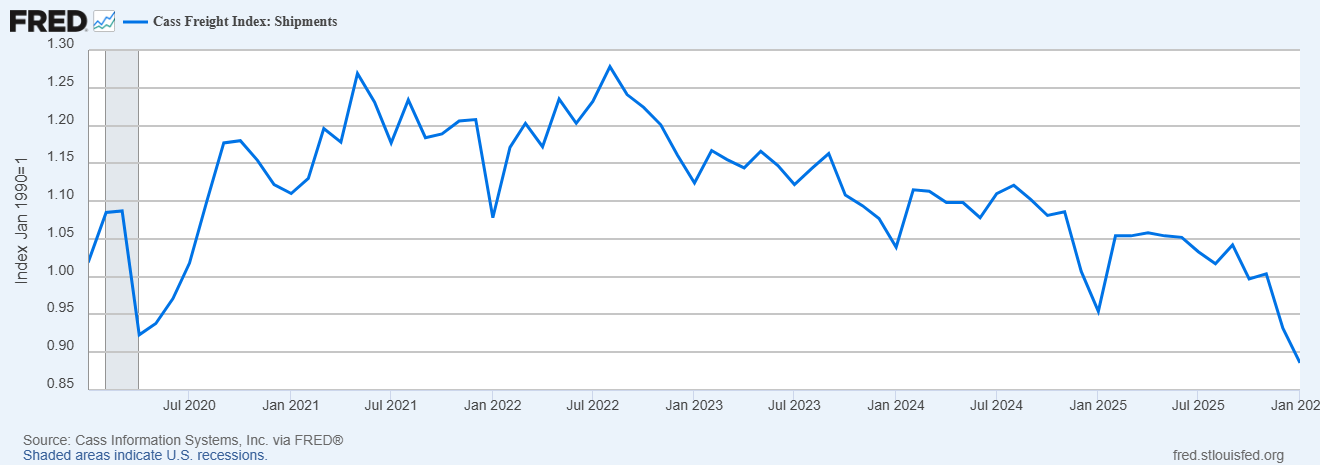
Logistics: Freight volumes are falling (fewer goods being moved).
Travel: TSA growth rates are declining (fewer people flying).

Business Health: Corporate bankruptcies continue to trend higher.

Economic Output: GDP growth is visibly slowing.
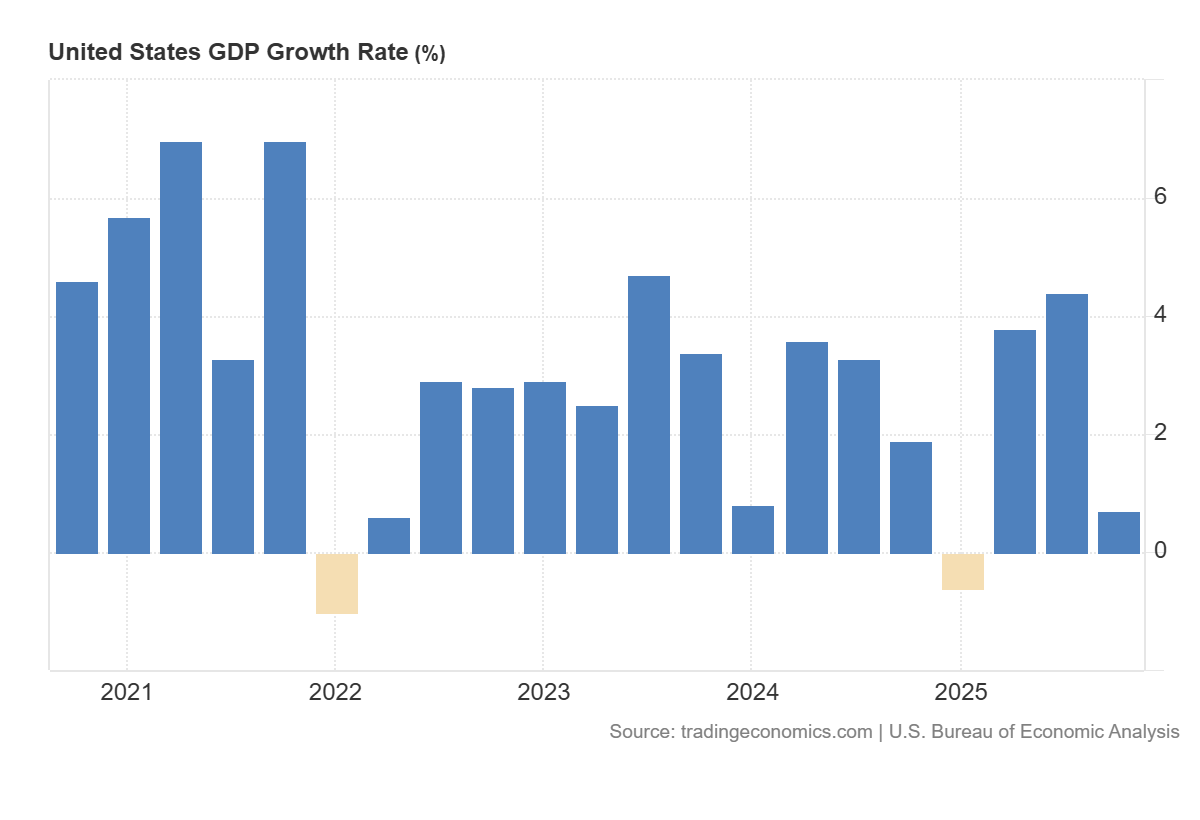
QoQ GDP Growth Rate - 5-year chart
And this is before accounting for the recent oil and gas shocks as the initial Q1 2026 GDP growth rate has yet to be reported.

YoY GDP Growth Rate - 3-year chart
The Geographic Reality
National averages often hide local pain. According to Moody’s, as of October 2025 22 states are in or near a recession. Historically, when nearly half the country feels the pinch, it’s only a matter of time before it spreads through trade and credit to the rest of the nation.
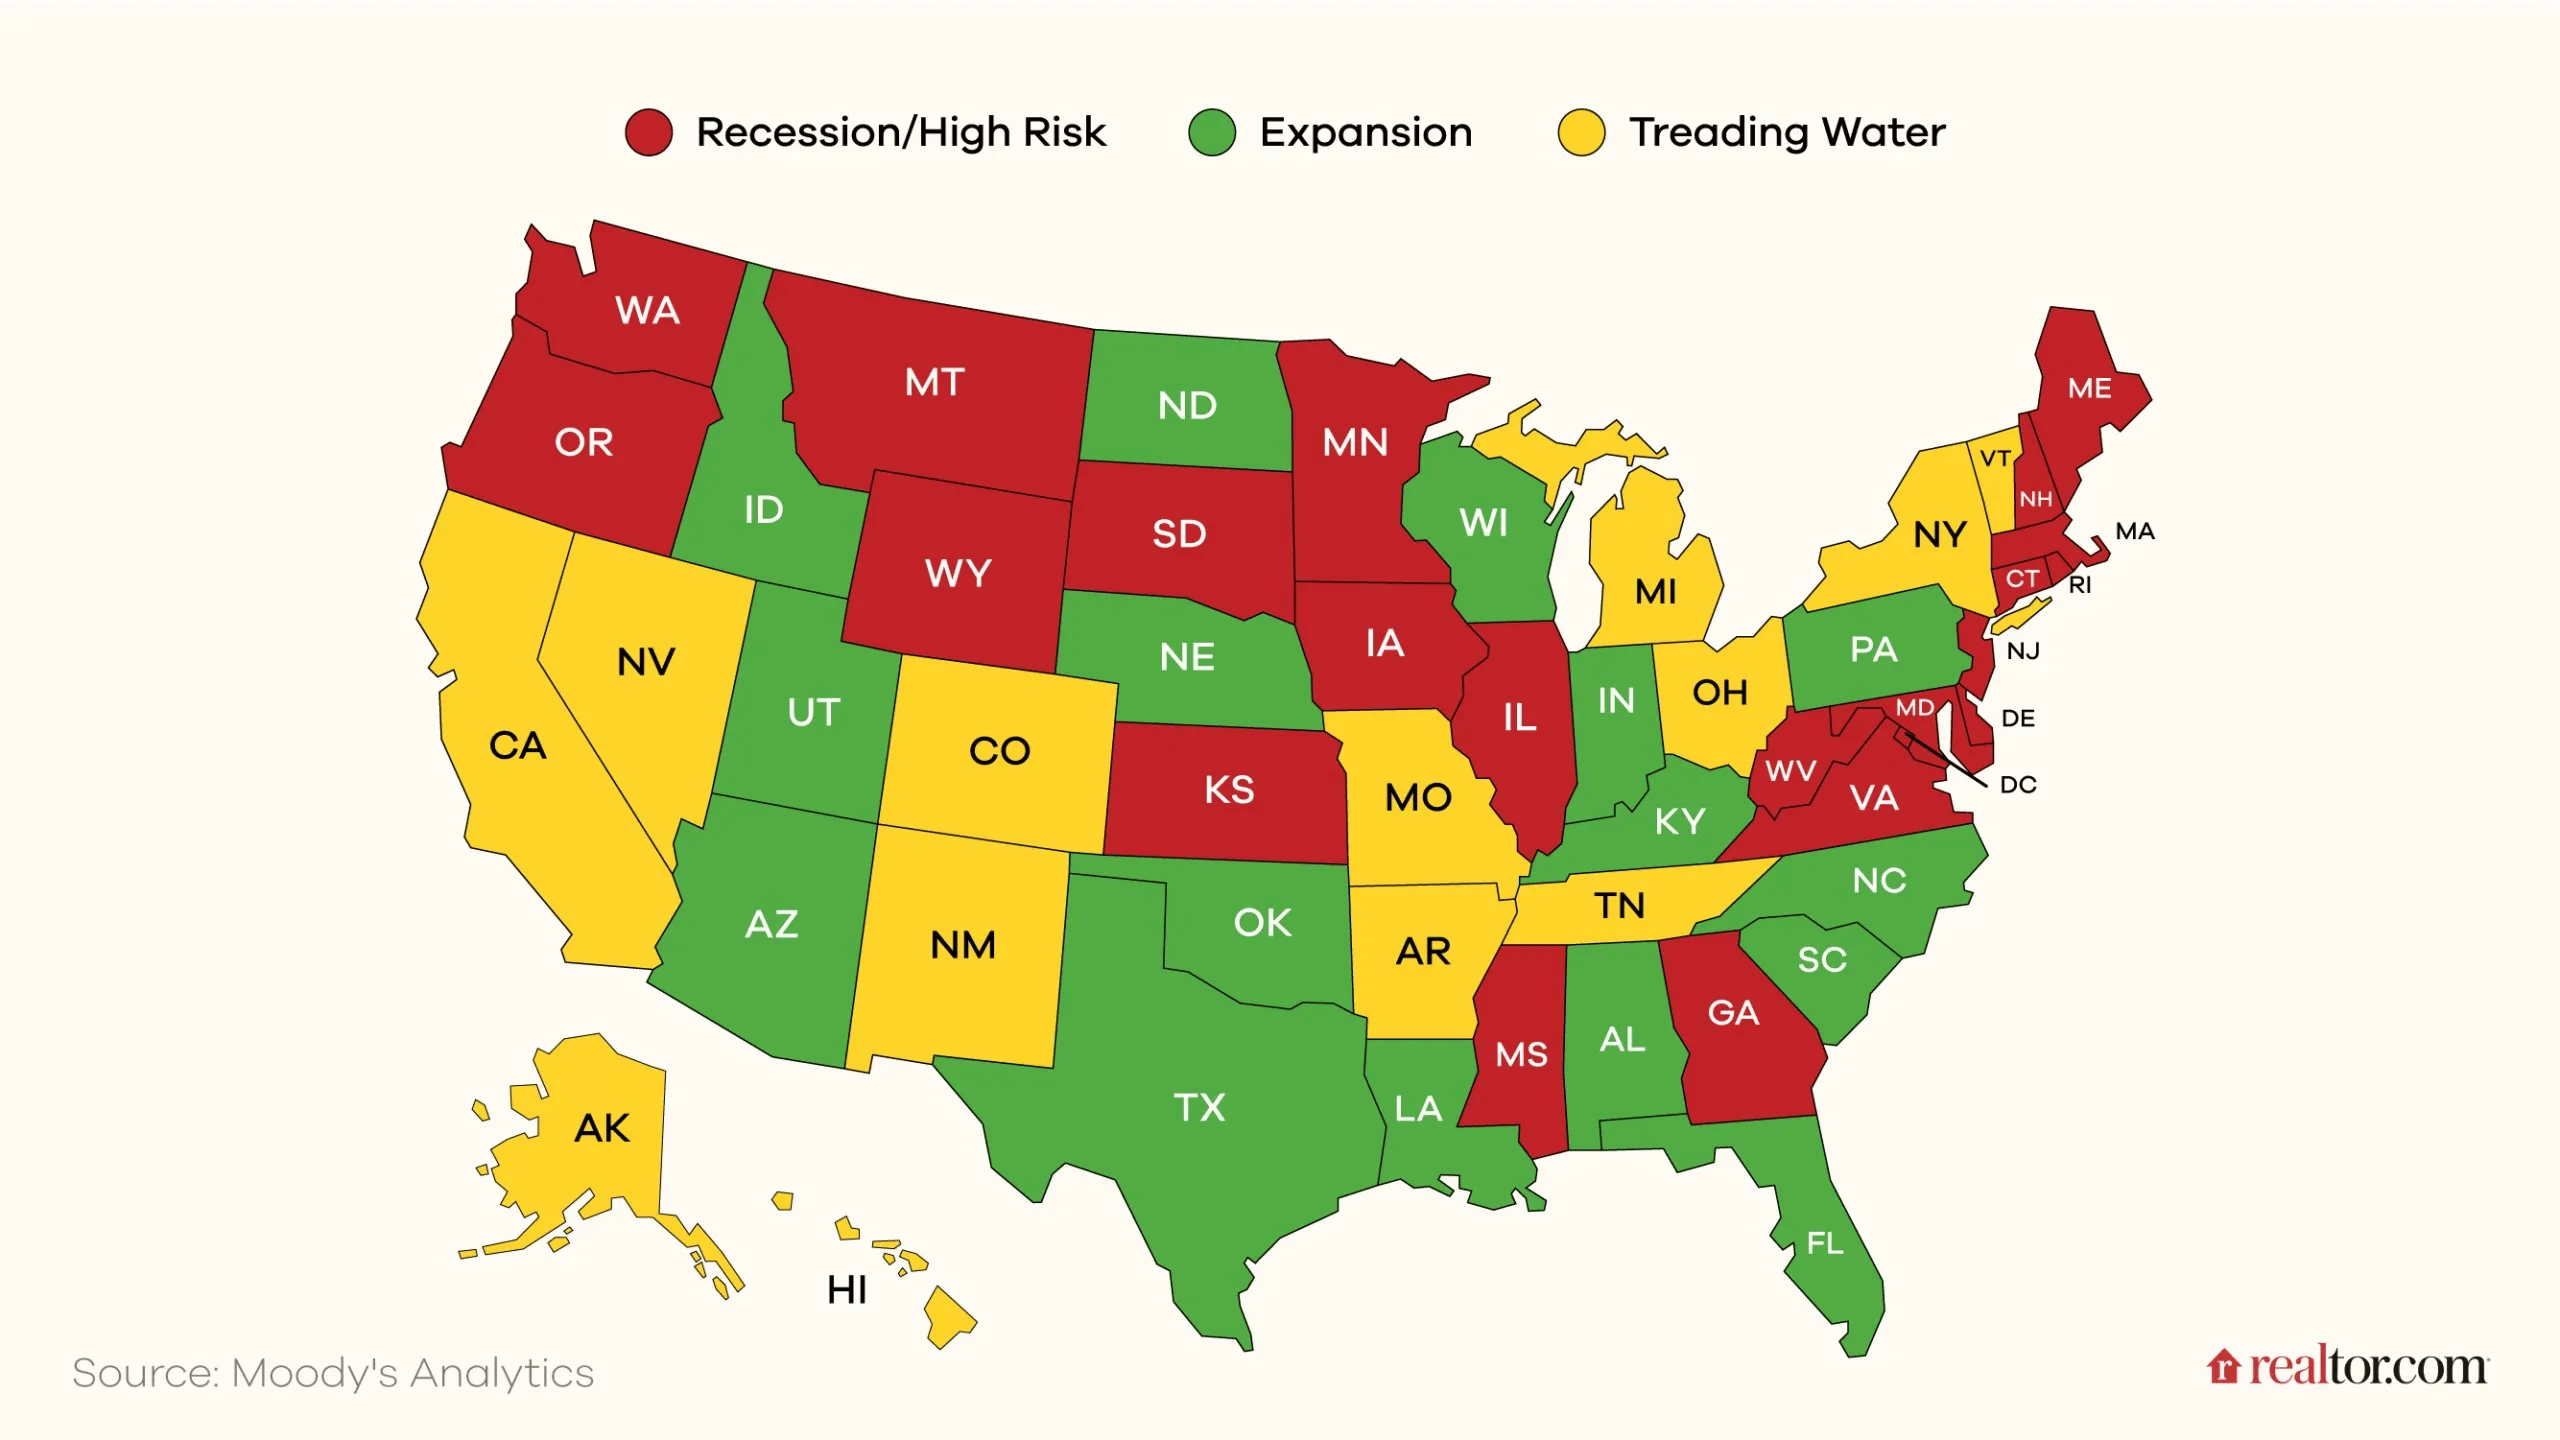
The states affected span multiple regions and sectors (energy, agriculture, manufacturing, and government-heavy economies) which points to a broad underlying shock (tariffs, immigration policy, federal job cuts, debt pressure) rather than isolated local issues.
The Timeline: When Does it Become "Official"?
Great question. Wish I knew.
The Economy Tracker is a leading indicator. Meaning it’s built to tell us where the puck is going, not where it was. As it did in April 2024 when it said an Economic Slowdown was approaching. Which no one was saying at the time. In fact, at that time it was becoming obvious that there was no recession in 2023 as so many were claiming was the case. Which means they were looking for a recession in the middle of an Expansion. Blown calls rarely get bigger than this massive whiff on their part.
By the way, The Economy Tracker moving into Economic Slowdown also told me to be on the lookout for a correction last year which allowed me to be prepared for the 20%+ one that happened Feb-Apr 2025.
But I digress…
Since The Economy Tracker is built to be a leading indicator, it tends to enter each phase before conditions are felt on the ground. The shortest lag between the Tracker entering Recession Phase and the official beginning of the recession was 2 months in 2007. Although the recession wasn't widely recognized until about 9 months later.
The Lesson: By the time a recession is officially declared on the news, the worst of the market damage has usually already happened.
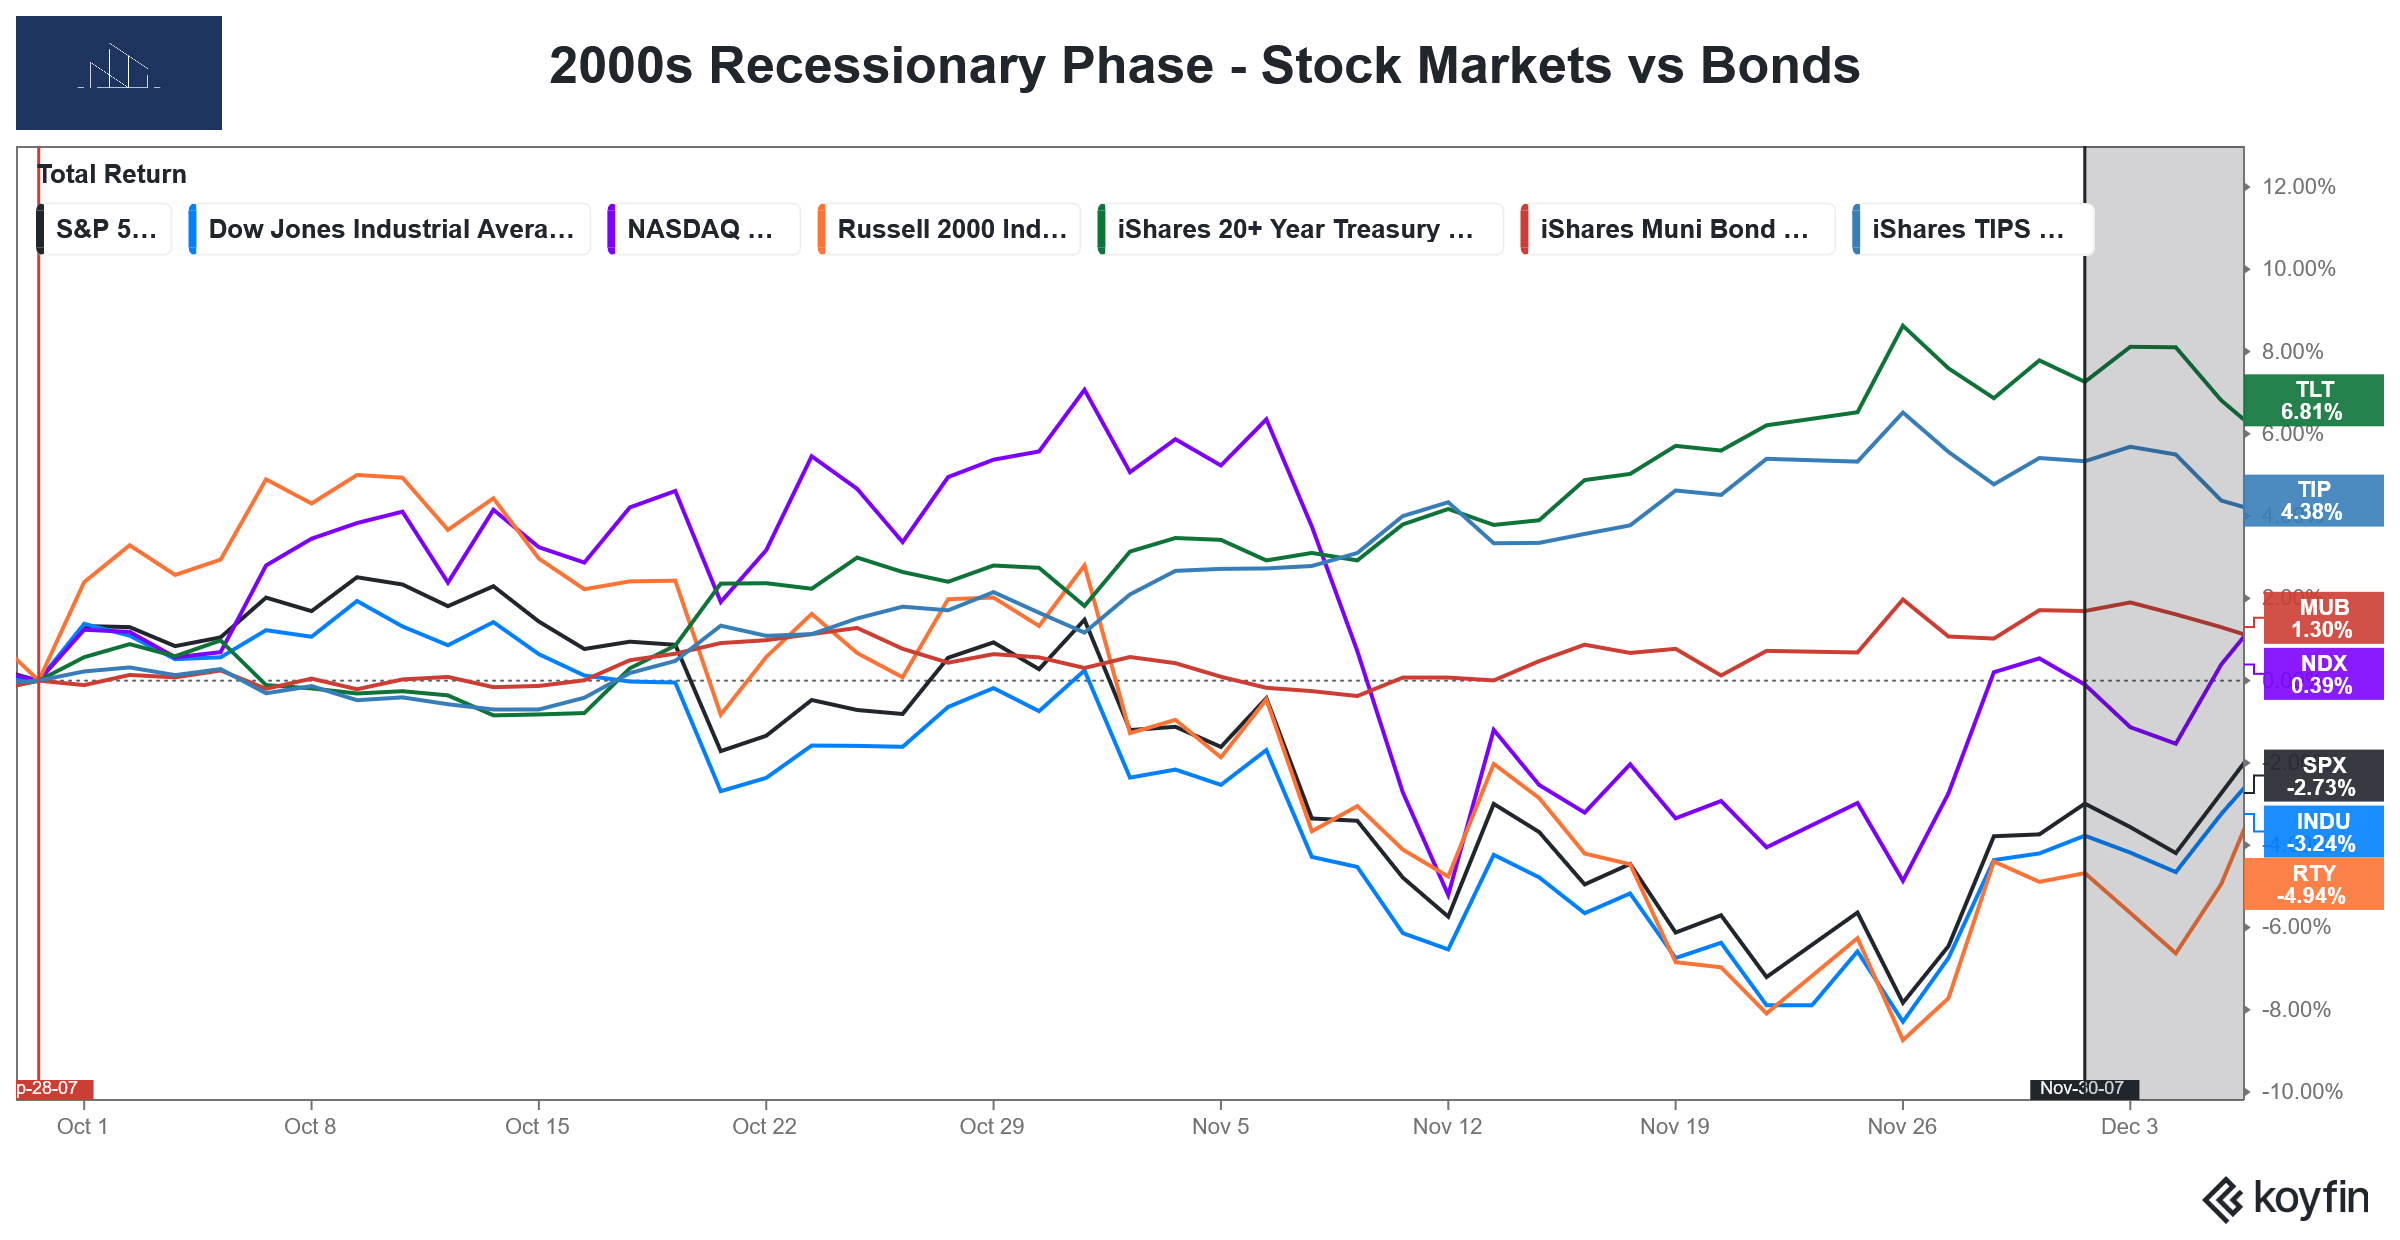
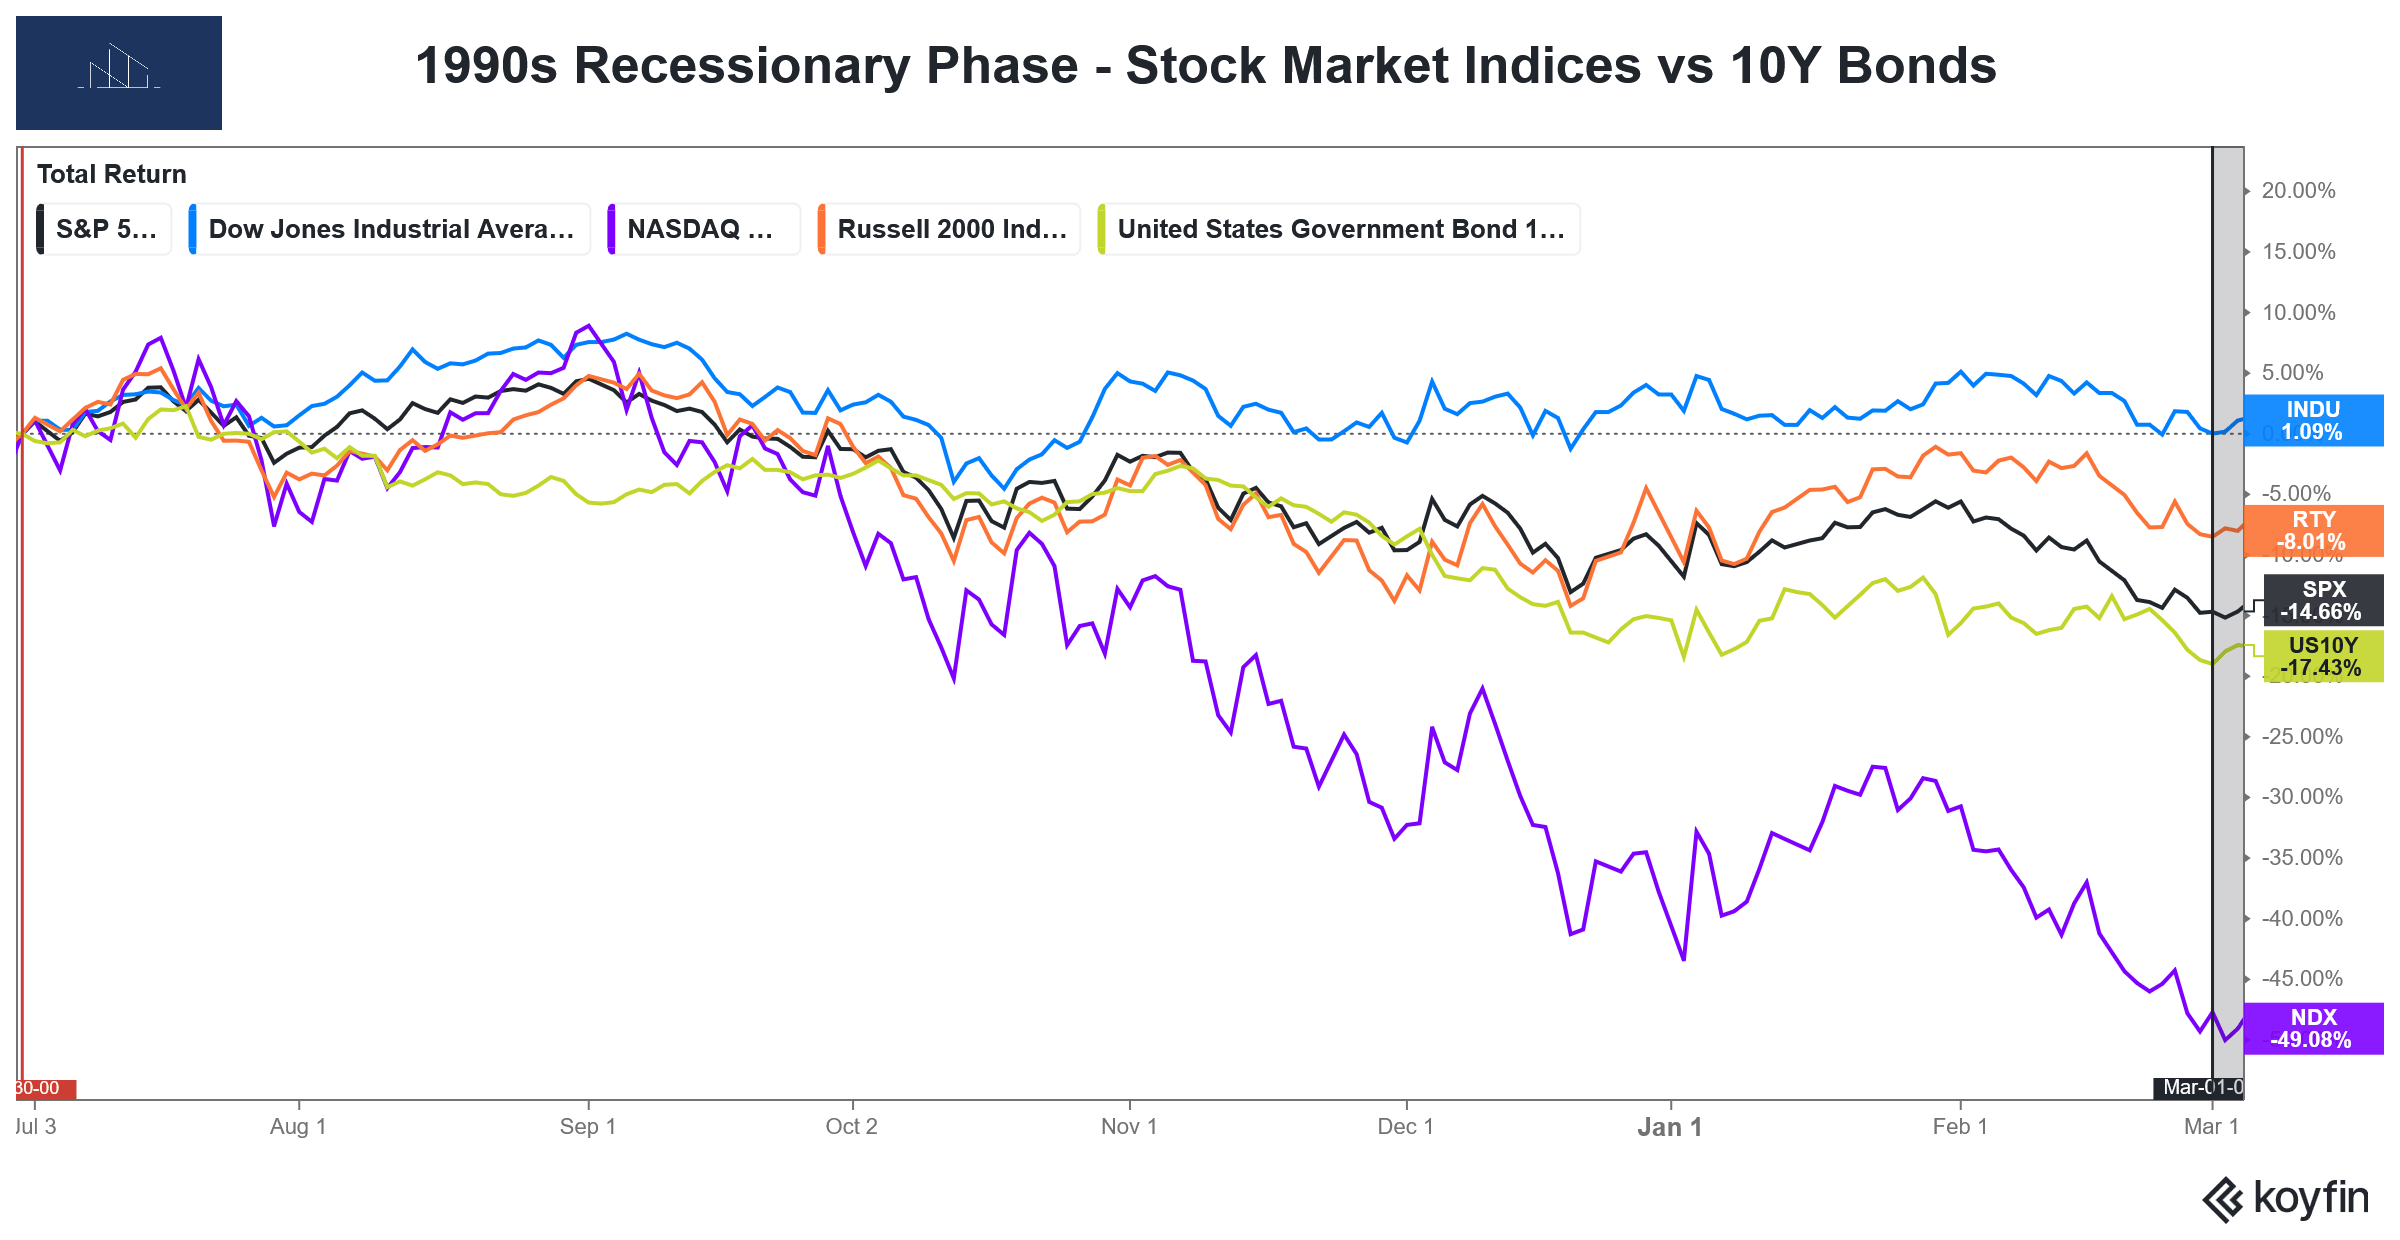
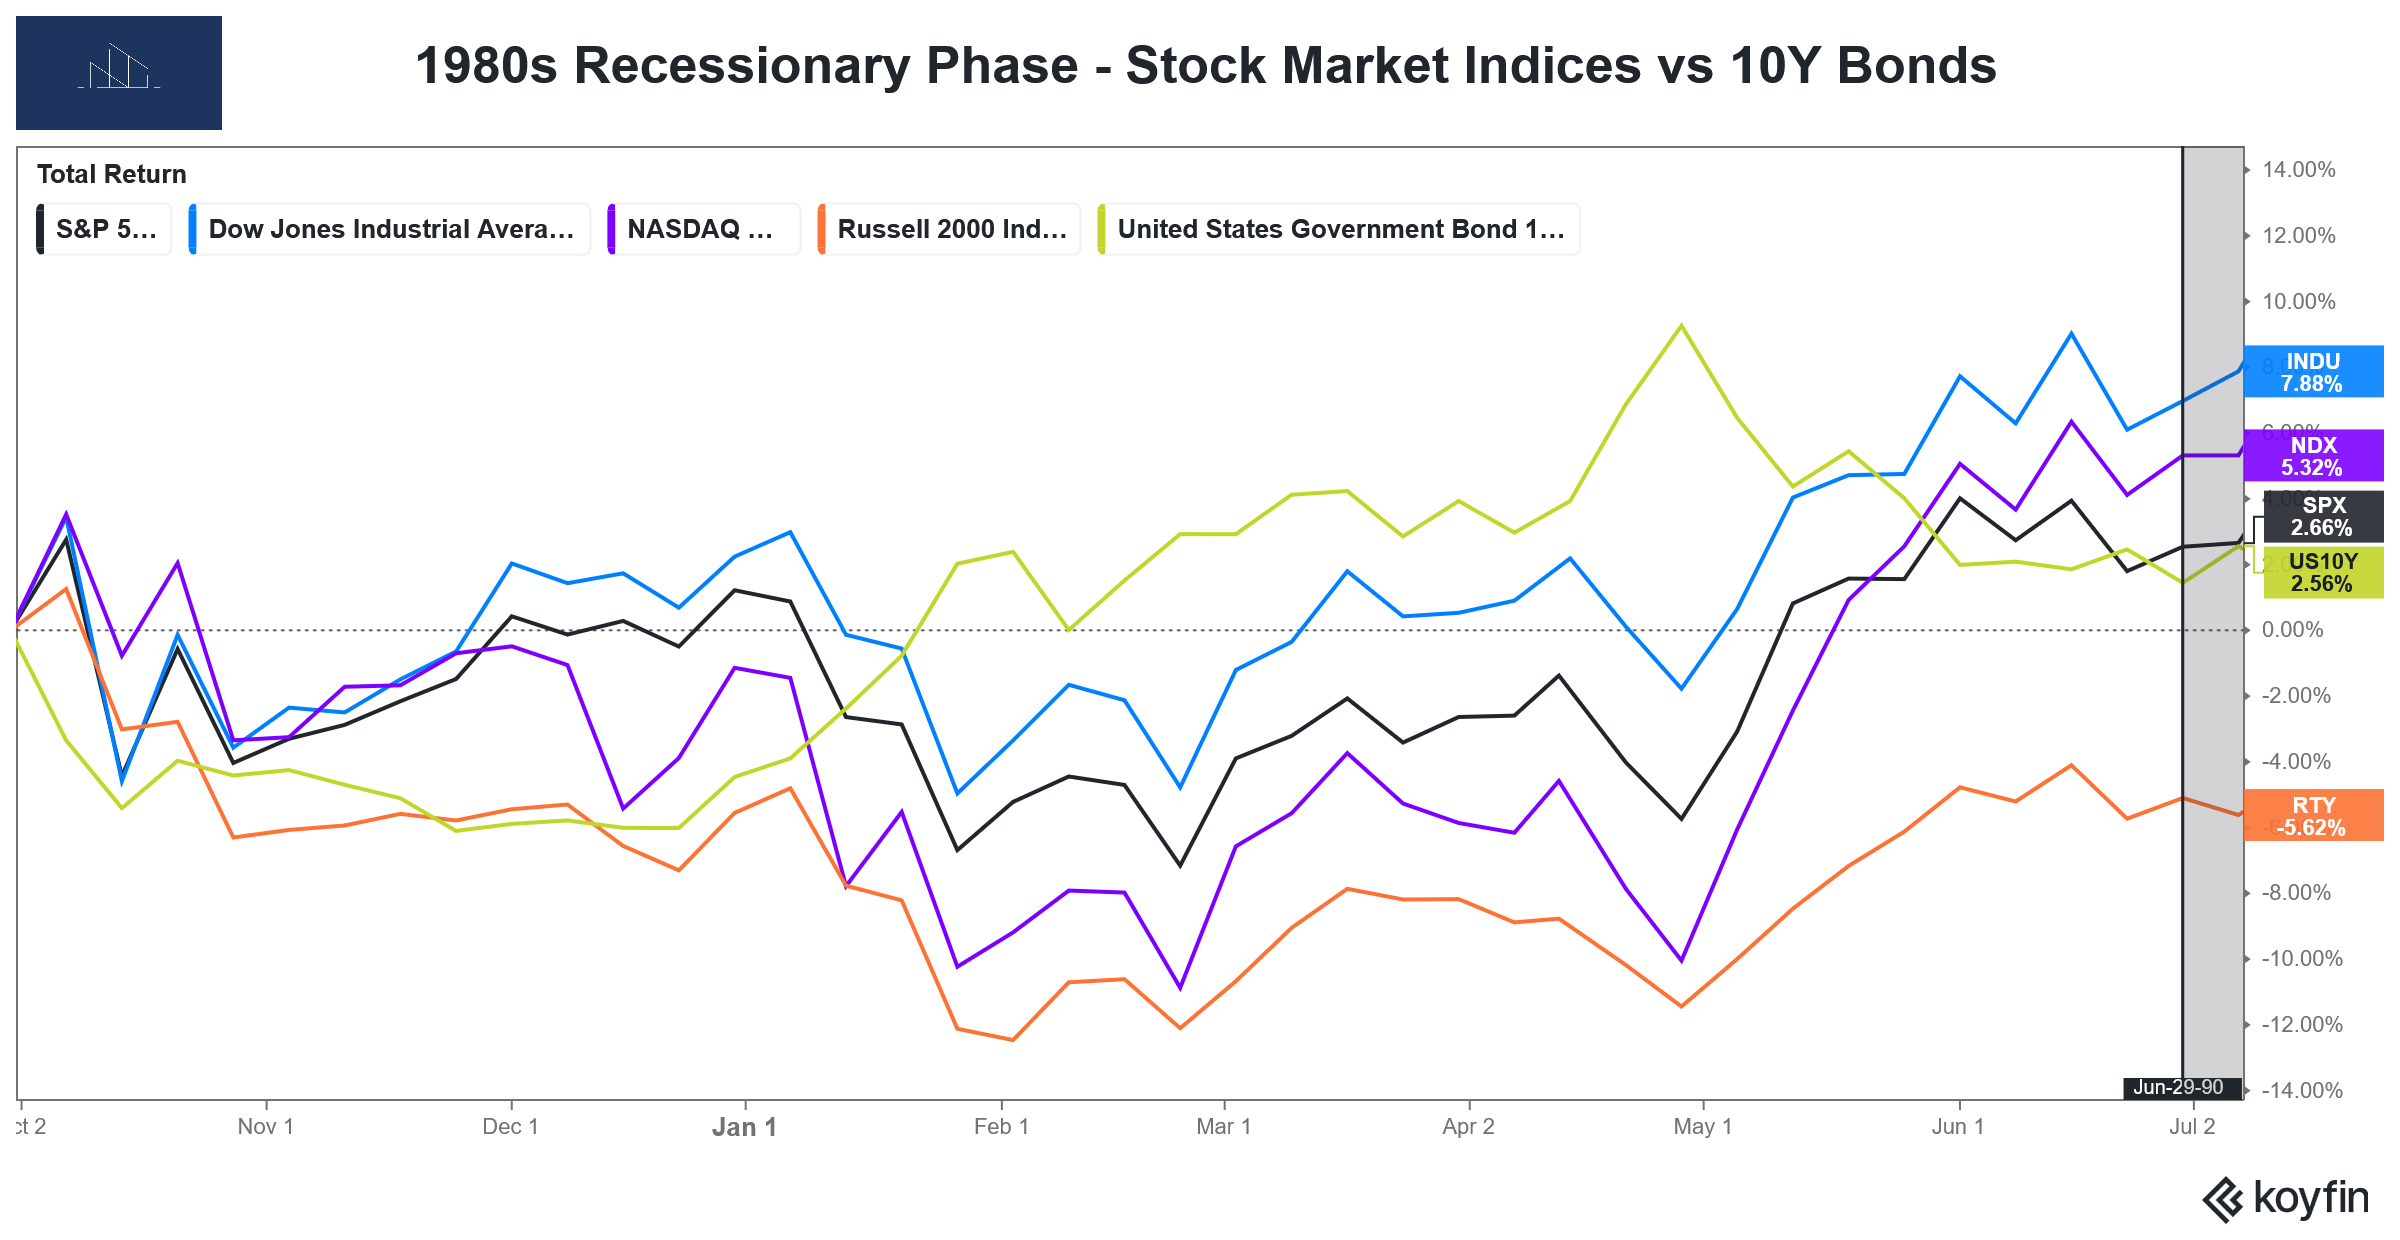
Here’s a look back at how stocks and bonds performed the last four credit cycles until the beginning of the official recession.
For reference, the red line at the far left of the charts is when The Economy Tracker went into Recession phase, and the black line and shaded part on the right is the beginning of the actual recession.

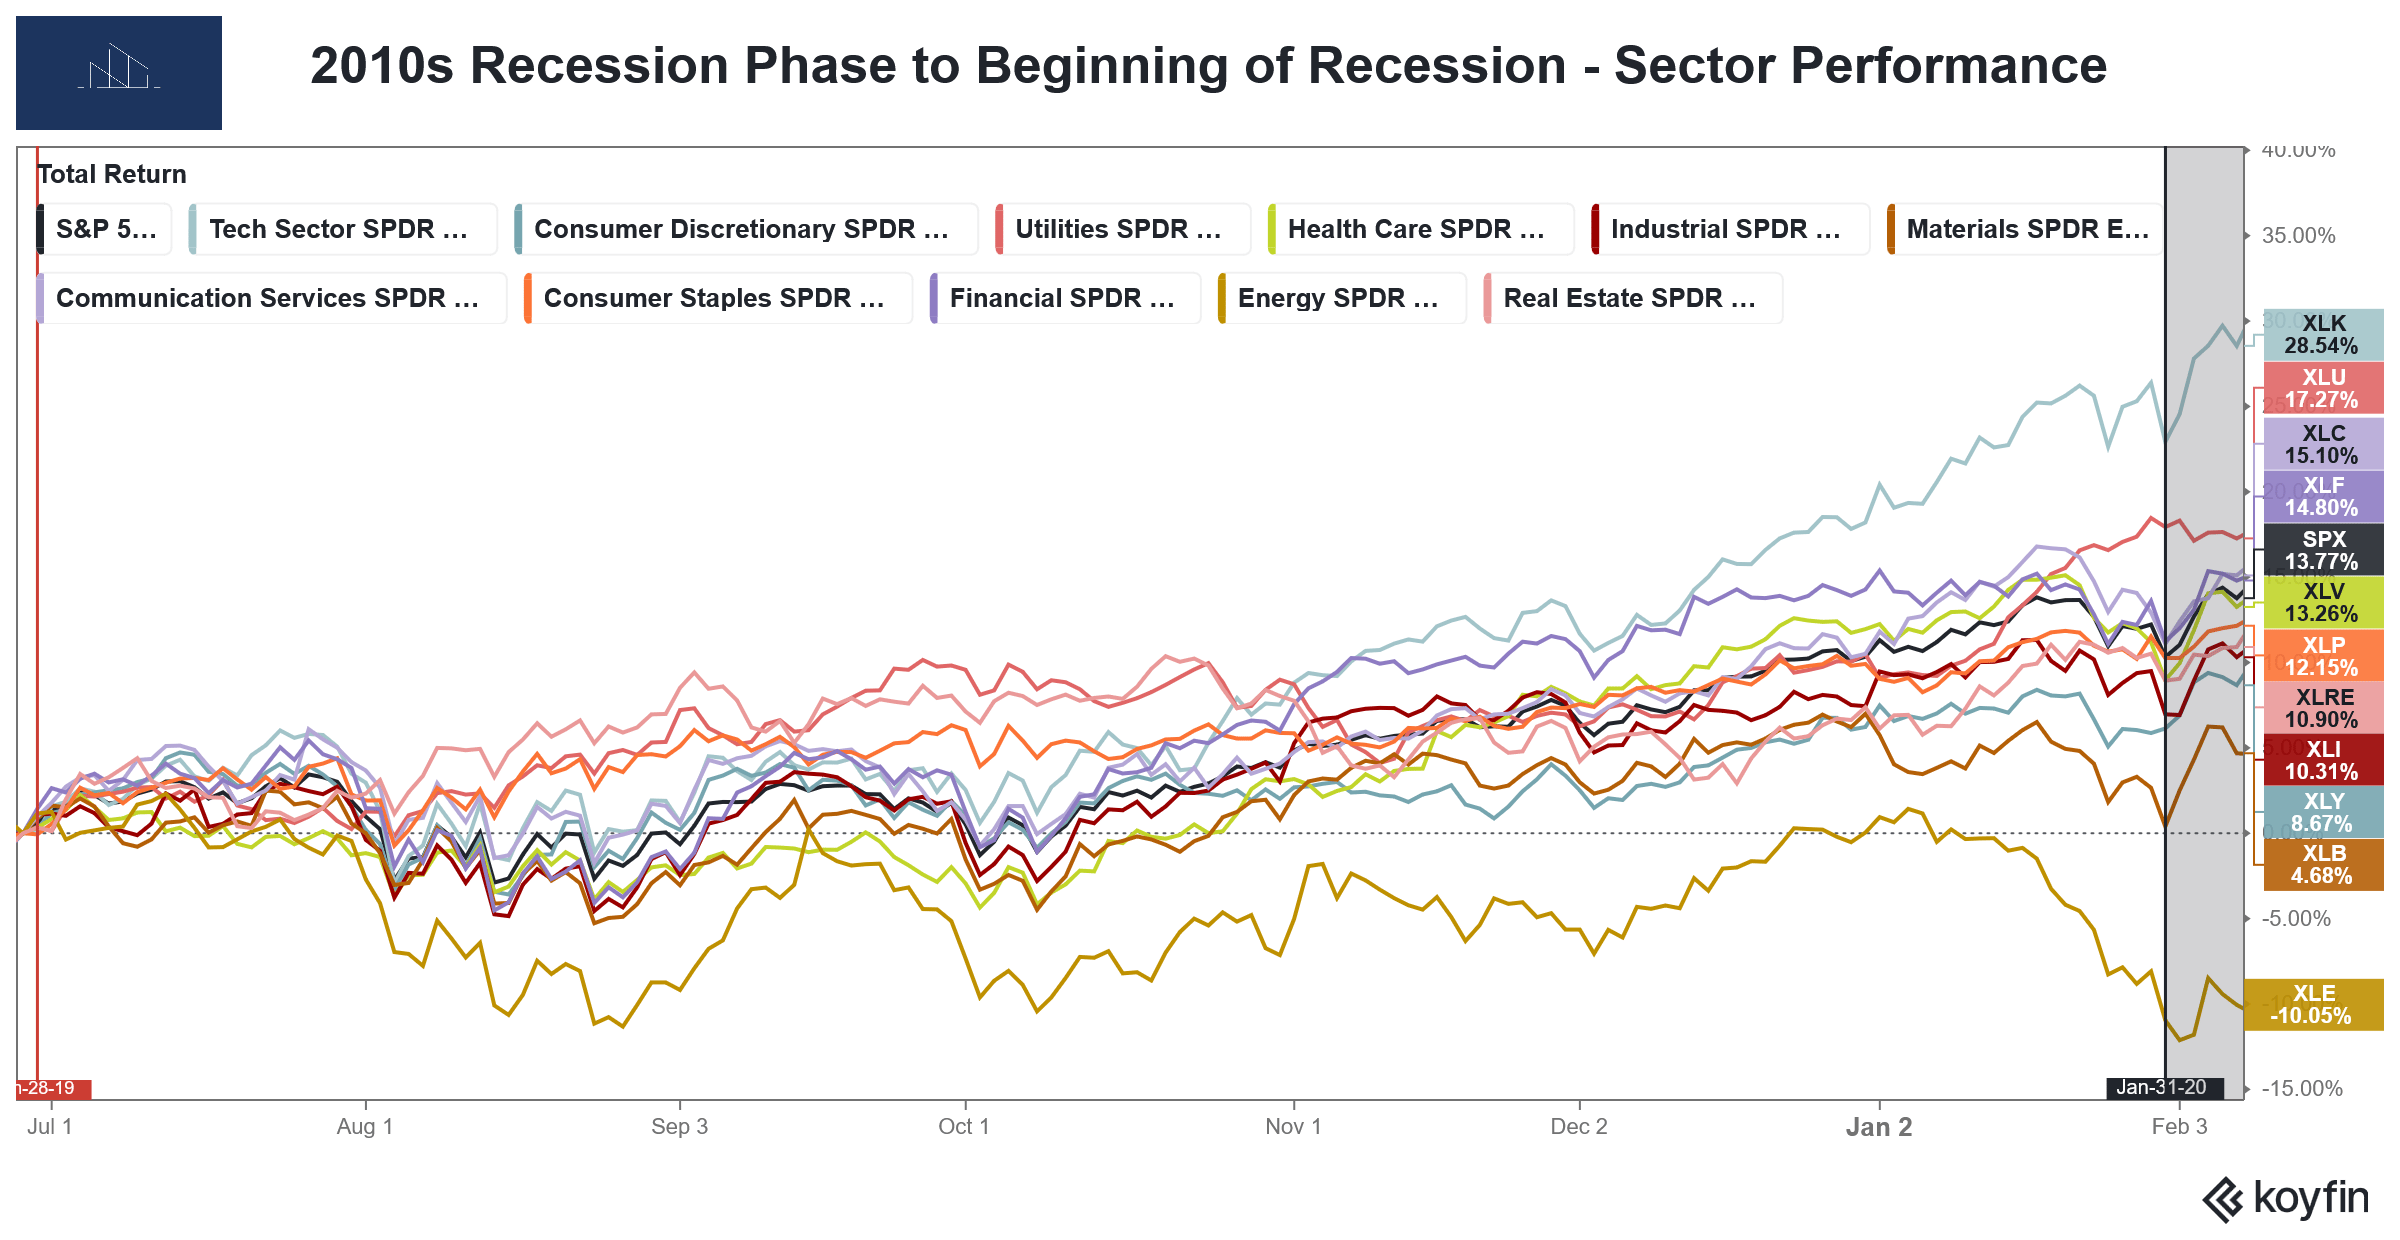
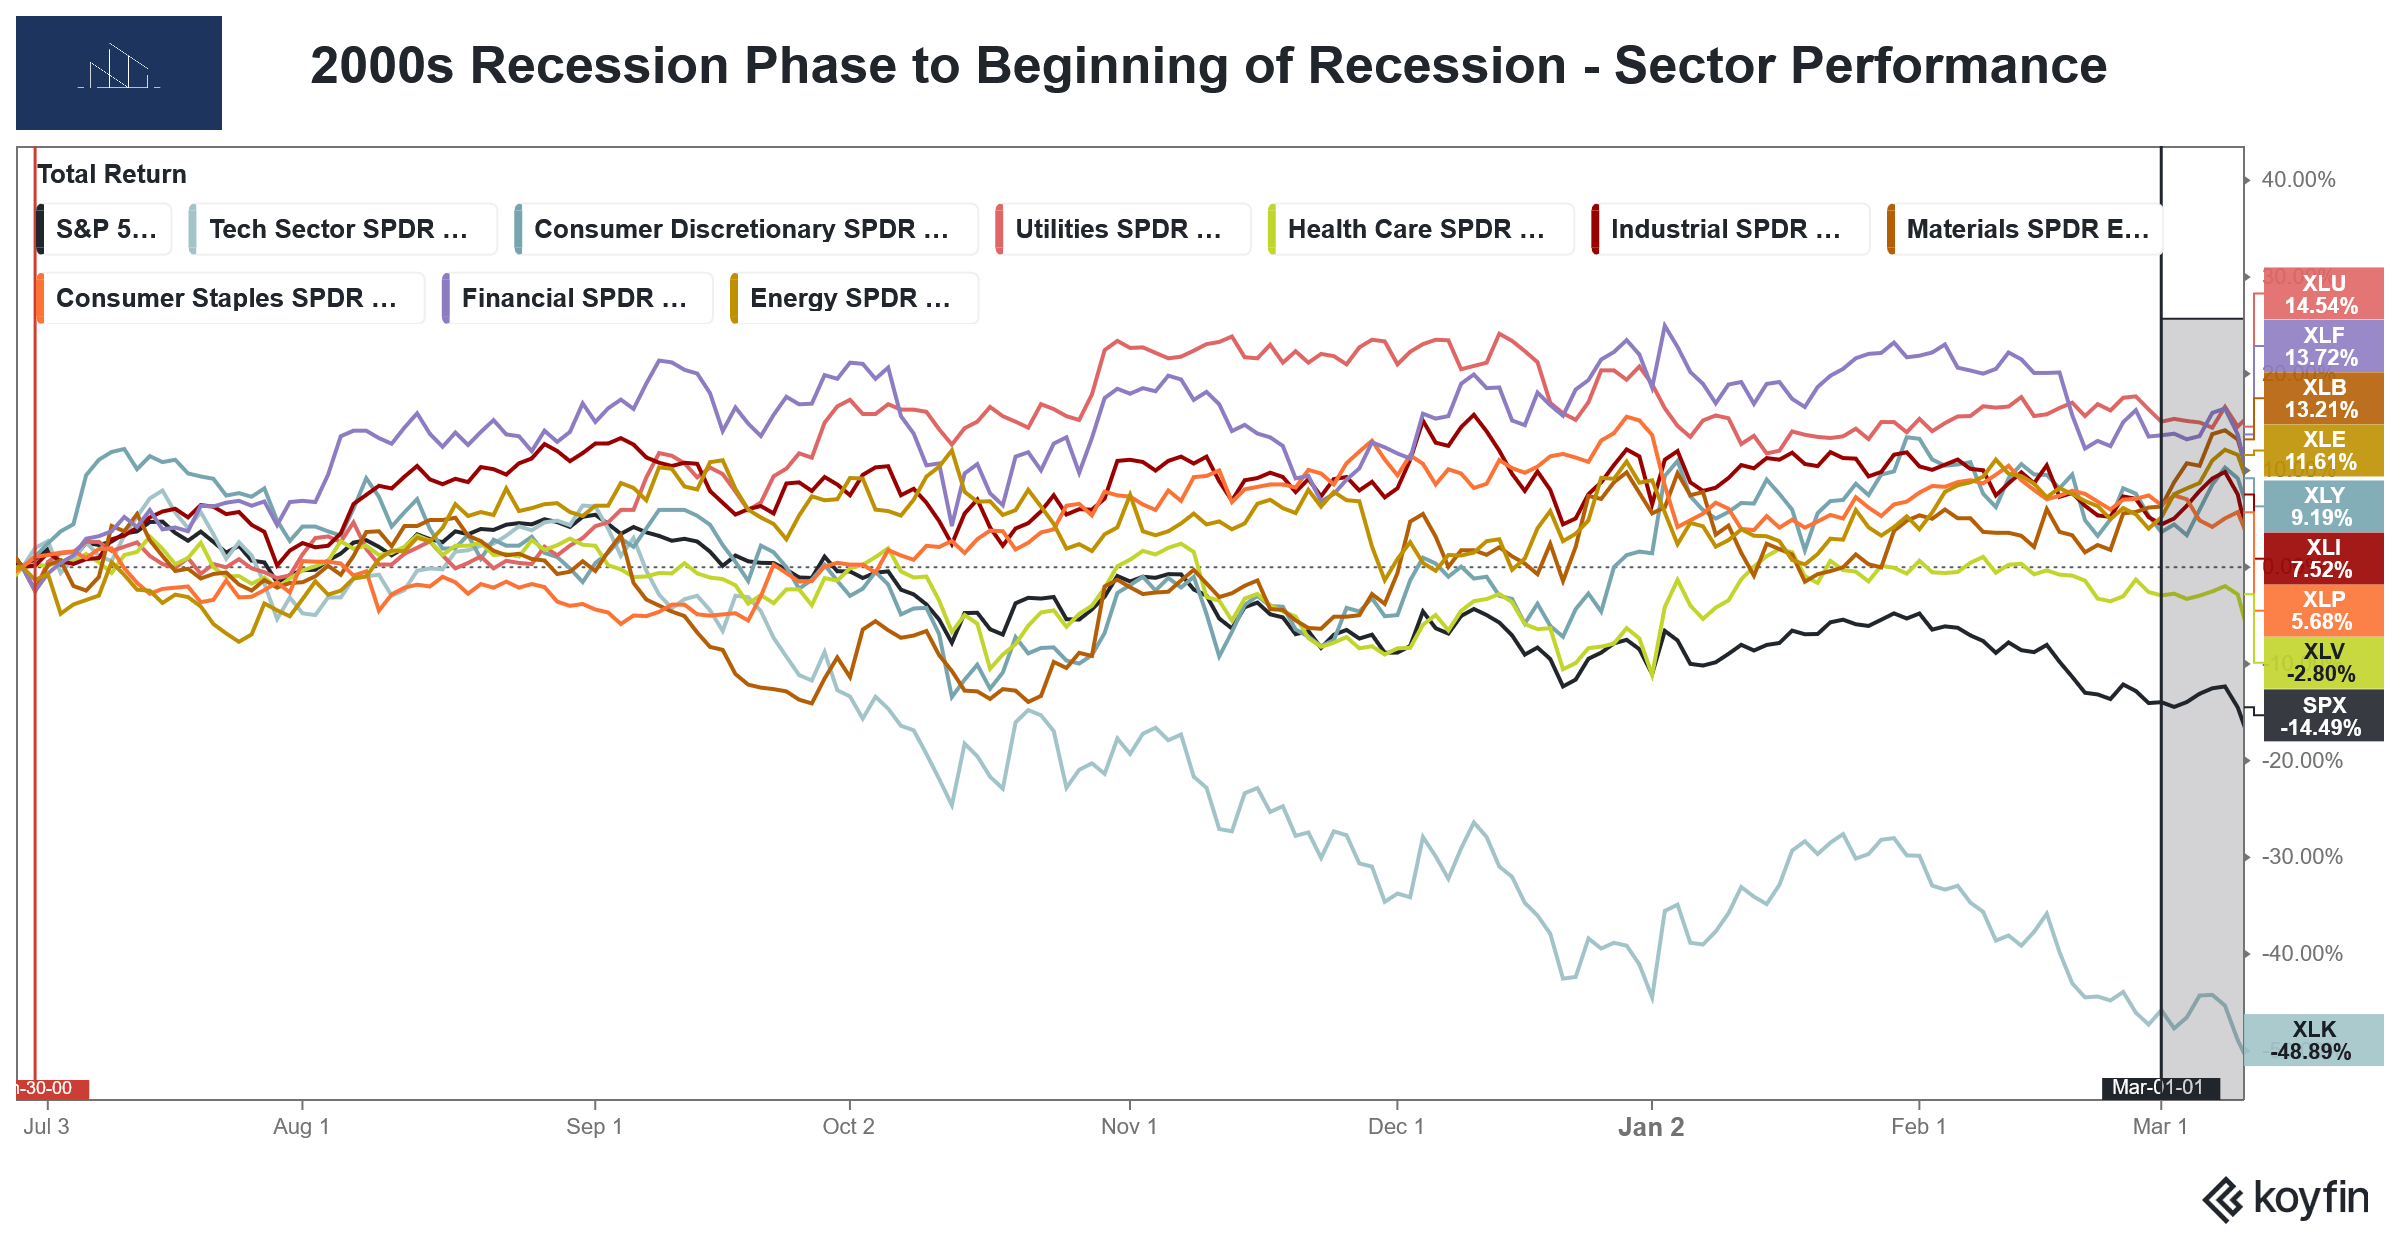
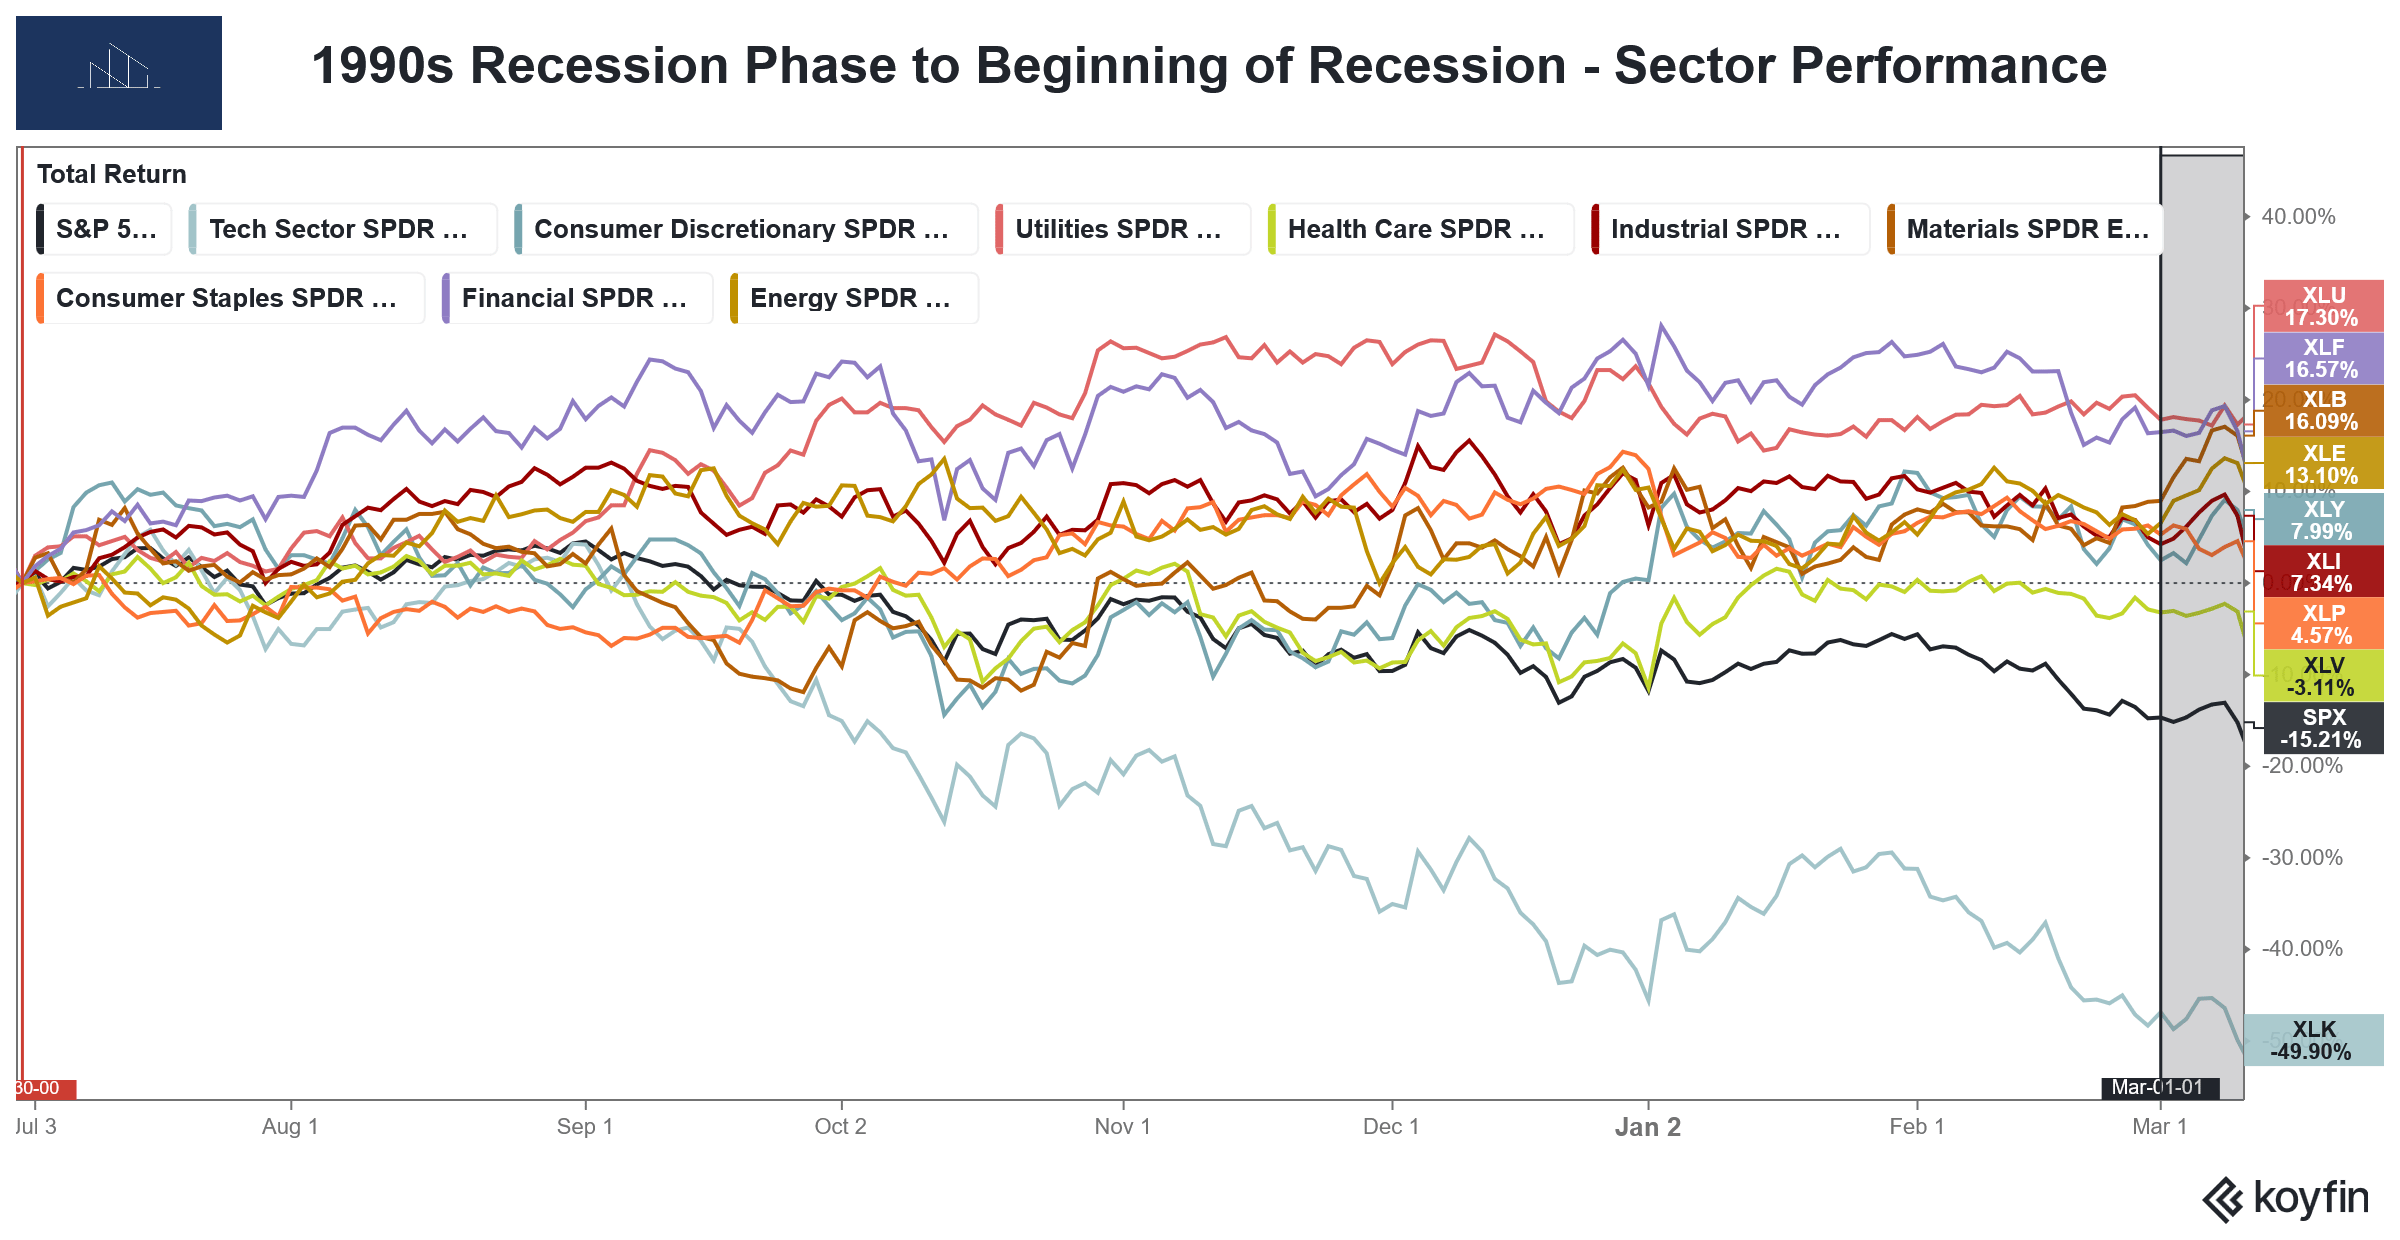
And below are the sector performances from the past three credit cycles when The Economy Tracker went into Recession phase until the official start of the recession.
The Wildcard: Stagflation
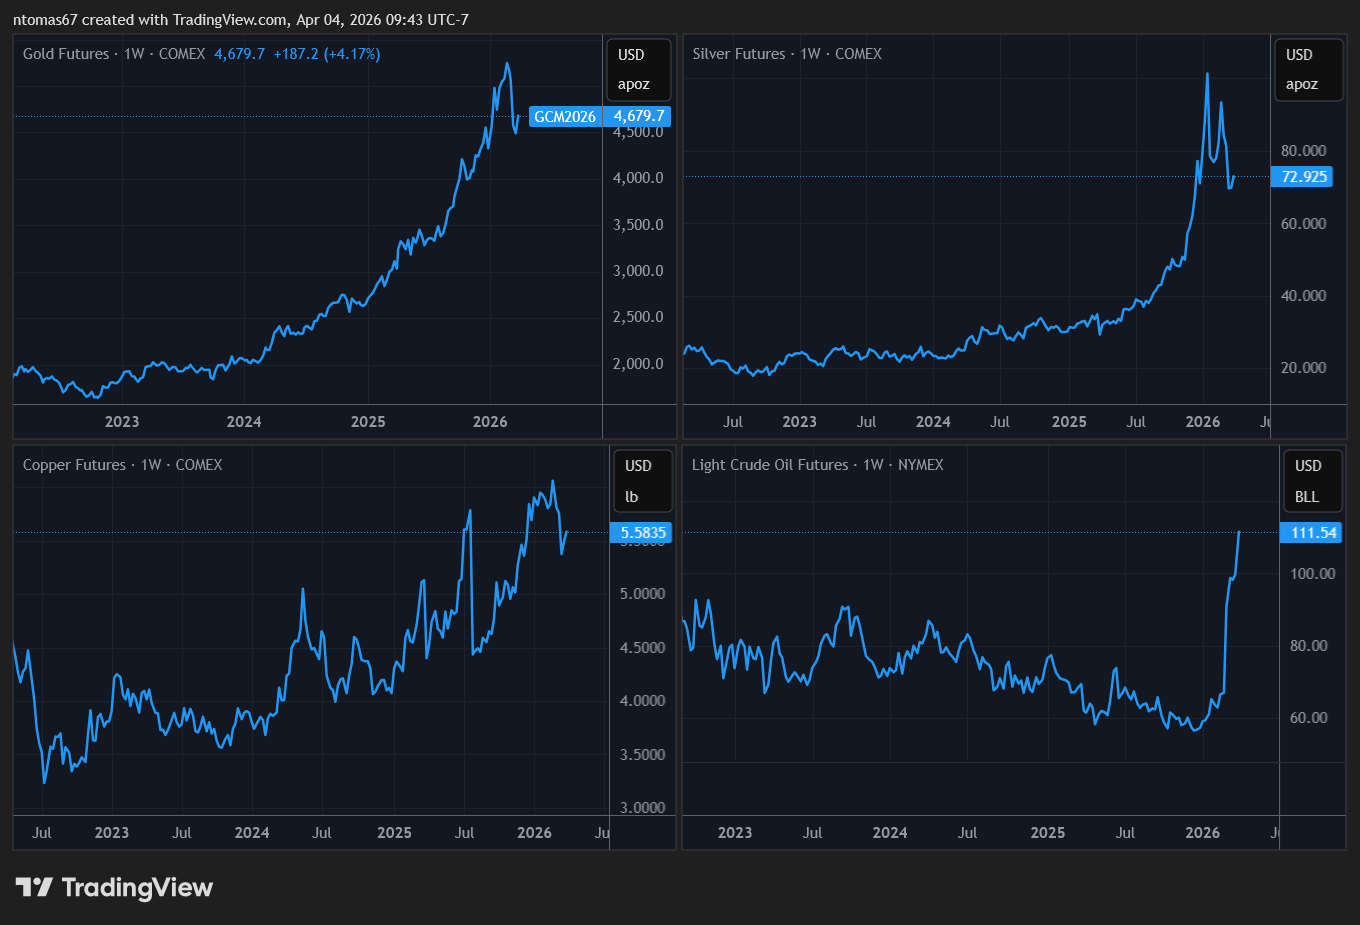
The biggest risk right now is Stagflation: the combination of a weakening economy and rising prices.
Usually, inflation drops when the economy slows. But due to sustained tariffs and Middle East energy pressures, we are seeing an increased likelihood of another wave of inflation. Trying to force growth in this environment is like redlining an engine that’s low on oil. You might get a brief burst of speed, but the eventual breakdown will be much more costly.
Unfortunately, inflation continues to trend higher since “Liberation Day” last April:
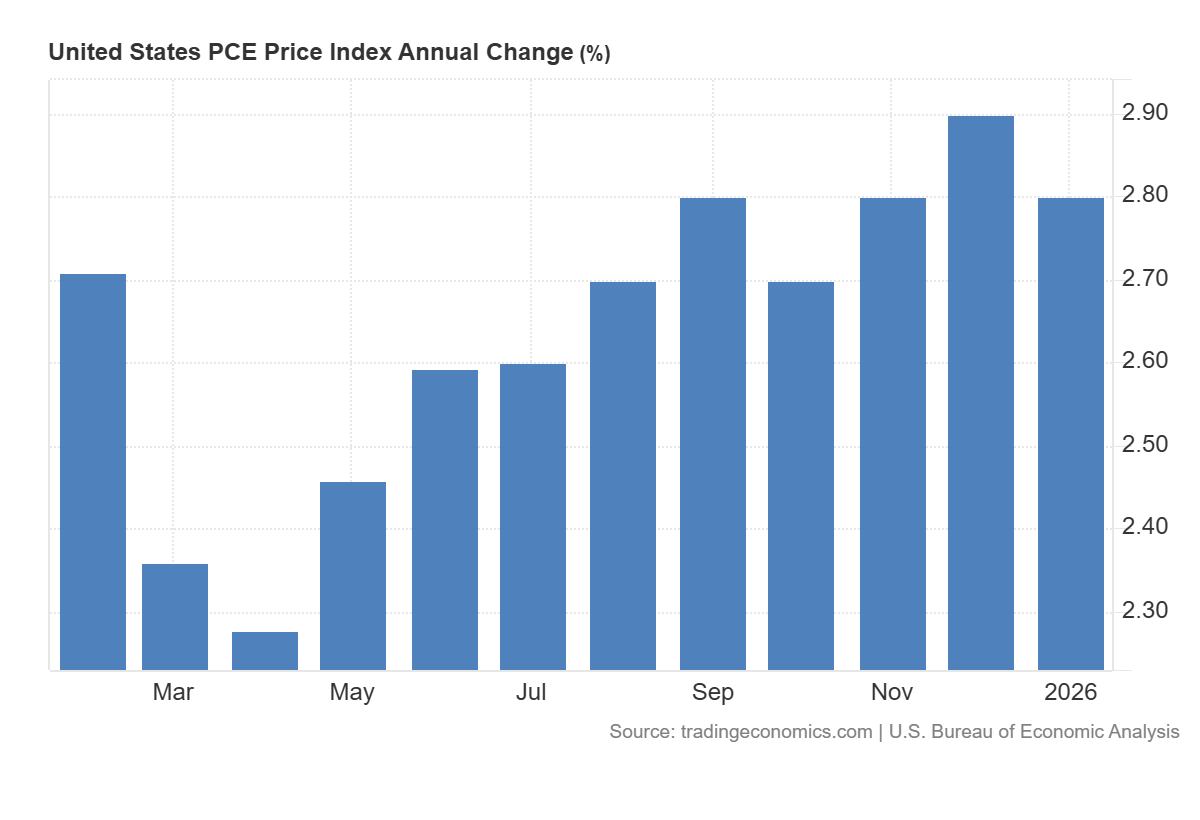
And the set up is now there for it to once again surge higher:
How to Protect Yourself
At this stage of the cycle, many will point to a momentary surge in single economic metrics to claim the coast is clear and the economy is re-accelerating.
Many will also unknowingly distort common tropes about the economy thinking that it means the worst is behind us. Things like “Transportation and Industrials sectors are surging, and they lead the economy.” Doing so misses the point entirely. These things do not simply lead the economy, but are leading indicators in which there are many more that are saying the exact opposite.
Don't be fooled.
This is similar to an athlete rupturing their Achilles tendon, and pointing to their fully functioning elbow as a reason they are fit to play.
We are at the point in the cycle which fools the most people. Especially those who have been all bulled up over the past three years.
If we are going to get through this credit cycle and into the next without a recession, there will be plenty of signs. However, none of them are there yet.
Of all the times to stick with what you know and understand best when it comes to investing, this is the moment to do so right here. More importantly, this is the time to circle the wagons and protect what you have worked so hard to accumulate.
Keep in mind that this is coming from someone who literally speculates for a living and is wired to look for and be comfortable with a lot more risk than most people.
I’m a “get in the left lane and hammer down” type guy. However, now is one of the few times I say it’s time to C.Y.A.
One Possible Sequence for Which I’m on the Lookout
Inflation digs into profits and margins while it also continues to weaken overall demand in the economy.
This leads to unemployment spiking higher as reality overrides optimism and hope.
Meanwhile, the continued economic weakness creates more issues within Private Credit which in turn zaps more liquidity from the system.
All of which would eventually be reflected in bond yields falling and a rising dollar as money seeks shelter. Which leads to falling stock prices as bond prices rise. A classic risk off scenario.
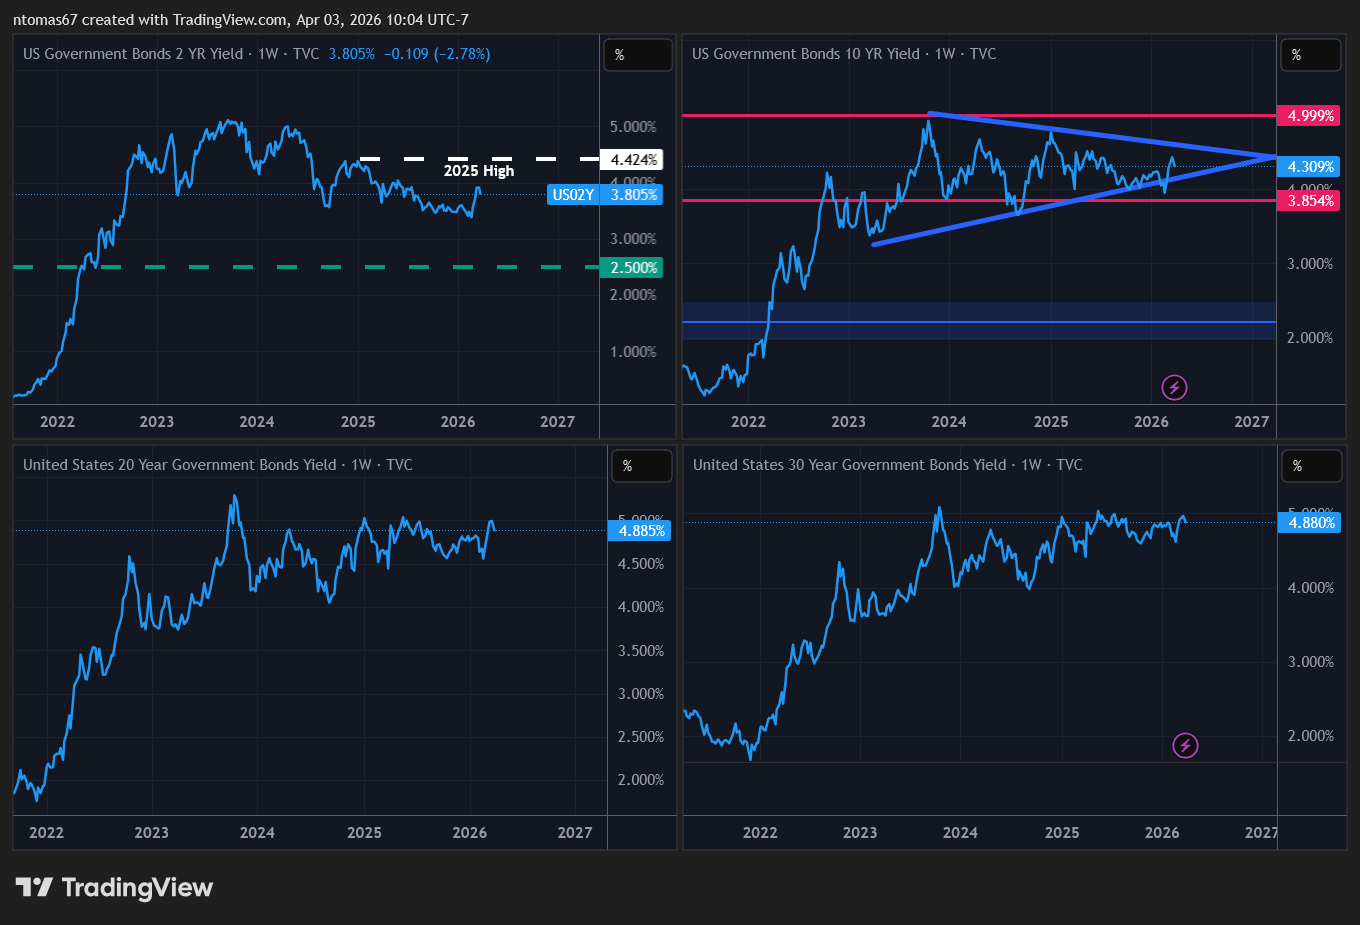
2-yr, 10-yr, 20-yr, and 30-yr Bond Yields
Where the Opportunity Is
With that being said, there’s always an opportunity somewhere. And the irony in posting about an approaching recession today is that I think markets have found a near term bottom this past week and move a bit higher in the coming weeks. Using $SPY ( ▼ 0.81% ) , I’ll be watching $663.50ish, $671.50ish very closely for resistance. If it fails there, then I think we roll back over $591ish - $575ish next.

And I wouldn’t be surprised to see $680ish on a bounce here too. If it does, I’ll look at the swiftness and path it took to get there to possibly re-assess my view of markets in the following weeks and months. As I still wouldn’t be surprised if we squeeze higher before the real rollover if this is not the one.
But that reassessment at $680ish stops at markets, and does not include the economy.
Final Thought
Recessions aren't accidents. They're a natural part of the cycle which happen every 5 to 7 years on average.
The signals are there now and beginning to accumulate. This is usually the case, and it tends to happen well before the consensus catches up.
If you're reading this, you're ahead of the curve. You can hope for the best, or you can take steps to prepare so that when the next real opportunity arrives, your capital and your mindset are both intact.
Remember, day-to-day life and corporate news tells us where the puck just was. The Economy Tracker tells us where it is going. You can get caught up in the masses fighting over what is no longer there, or you can get into position where it tends to go next.
On a personal note, I used what The Economy Tracker was saying last Summer to research the oil and gas industry in depth. That led to a great scoring opportunity which I’ve capitalized on the past few months.
If I had instead listened to the consensus at that time, I would not have been in a position to capitalize and it would have been a catastrophic beginning of the year for returns in the markets. Which is exactly what is happening to the vast majority of people now.
The choice is yours. Get ahead of the game, or get left behind with the masses smoking the same Hopium while corporate news tells you what has already happened so that you arrive to the action right when the game has moved on. Leaving you in a perpetual state of playing catch-up.
Markets reward those who respect the cycle, and punishes those who fight it.
Click the Leave a comment button if you have any questions or comments, or need something clarified. Don’t be shy. The main point here is to improve constantly. Questions and comments help us both and tells me what you are interested in learning/hearing more about.
If you enjoyed this post or found it useful, do me a favor and hit the like (heart button all the way back to the top of the post and to the left) and share it with others.
Reply