- The Economy Tracker
- Posts
- This is a Pivotal Moment
This is a Pivotal Moment
The Inflection Point: Squeeze or Crash?
Nick Tomas
April 13, 2026 • Estimated Reading Time: 5 minutes

Sponsored by
We are currently at a rare and pivotal moment. Most people won’t recognize the shift until it’s barely visible in the rearview mirror, but for those paying attention, this "inflection point" offers a massive edge. We are standing on a powder keg, and the odds that the next move will likely be extreme are higher than usual. Either a sharp squeeze higher or the continuation of a significant market decline or even a crash here are very much in play at the moment.
That’s right the “R” word last week and now the “C” word this week. Which makes sense as they go hand-in-hand.
That brings up an important question: Has the crash begun?
At the moment, I have no idea. But I do have a map of how to read and follow it in real time. I also have a plan to play it either way. I’ll share a few of those insights with you here.
But first a quick victory lap on inflation.
Nailing it on Inflation
It’s been nine months since I posted Inflation’s New Tailwind in which I dubbed the current environment “Trumpflation”. That has proven to be true as inflation has continued to trend higher since Liberation Day last April.

And now, we have added another much more powerful tailwind with surging oil and gas prices due to yet another inflationary executive action.

YoY CPI
This past week we saw a surge in inflation as reported in the CPI, as it jumped up to 3.3% in March. Significant, as it is first month to fully capture the impact of elevated oil and gas prices since the decision to go to war with Iran.
But here's what most people are missing: we are now exiting a period in which CPI was artificially suppressed since last November’s reading. As noted when it happened in the December 22, 2025 edition of Here's the Deal, the BLS opted to use 0% housing inflation growth in October due to the government shutdown. That decision pushed the headline number erroneously lower for several months.
Below is a snippet from that edition:

Here’s the Deal - December 22, 2025
Due to how CPI is mathematically constructed, we’ll more than likely begin seeing that distortion begin to reverse in April. Meaning April's CPI report which drops next month, is set to begin showing higher inflation rates at exactly the moment high energy prices are also beginning to feed into the data.
Which is why I called this another Wile E. Coyote moment from the President and his economic team: where an attempt to engineer lower inflation readings for a few months backfires. Which is now the case at the worst possible time due to the surge in oil and gas prices.
That said, this does not automatically mean a stock market crash is beginning. The last comparable setup was July–November 2021, when the Fed began quietly walking back "transitory" inflation language. Markets continued higher through that period and didn't peak until January 4th, 2022 as inflation rates continued to soar higher at the same time. History doesn't repeat exactly, but it rhymes. That’s where understanding nuance comes into play as an analyst, stock trader, and/or business operator.
Earnings Season and Economic Data More Important than Ever
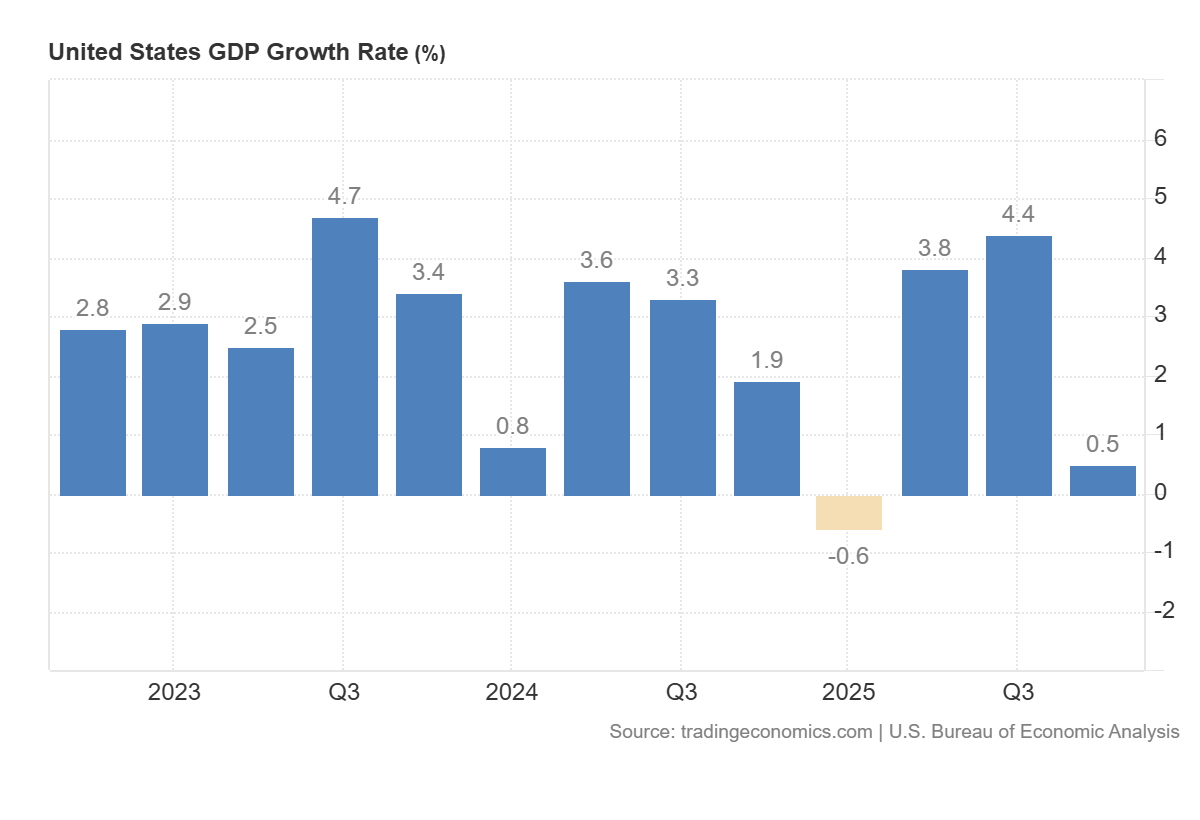
Now that the Q4 2025 GDP growth rate has once again been lowered from it’s initial and secondary reading to just 0.5% from 0.7%, two other major factors will determine the market’s direction in the coming weeks and months: Q1 Earnings and Inflation Data.
As it is once again earnings season with banks set to begin reporting on Monday, giving us our first look at how surging oil and gas prices in the final third of Q1, caused by the Iran war, have affected consumer behavior, corporate margins, and profits.
The Roadmap for the Coming Months Using SPY, TLT, and Bitcoin
The biggest mistake most people make at an inflection point like this is forcing a trade before the market has revealed its hand. In life and business, this is the same as making a decision before enough information is at hand. Amateurs believe this provides an edge, but pros with experience know how a poorly timed decision with limited information can be devastating.
Right now the edge is in preparation: knowing exactly what you'll do in the squeeze scenario and exactly what you'll do in the crash scenario, so that when confirmation arrives you can move with conviction rather than reaction.
Here are the scenarios I'm watching on three of the instruments which will tell the story:
$SPY ( ▲ 0.43% ) : Resistance sits around $683ish.

Bullish case: If price get knocked back down from around $683ish and it is to move back up, look for support at $674–670. If that fails, then look for $665–655 as the next level of support. The higher the support level that holds, the better the odds for a move to new all-time highs. Should either of those levels hold, look for some resistance around $700 and then again around $715ish.
Bearish case: Should both levels fail to hold and price moves back to below $640ish, then there is a strong possibility that markets go much lower. First support zone is $590–575. Next meaningful level is 505–525. A move to ~$480 would represent a 30% decline, at which point I'd expect a significant bounce back to $600–630, at which point I'd look to get short again, targeting back below $480 and potentially down to $455–430, with next support around 405–400. Worst case, a full 50% drawdown from the highs takes us to approximately $340.
$SPX ( ▲ 0.42% ) - Weekly Chart
$BTC ( ▼ 1.47% ) Bitcoin will help tell the broader risk-on risk-off story as well. Watch how it behaves first around $85K and then should that clear, look to $100K as the next level of resistance. How it handles either or both of those levels will give you a good read on overall risk appetite. If Bitcoin gives up it’s February low, then lookout below for this one. I’ll want nothing to do with it should that be the case.

Personally, I think bond prices have unfinished business at lower levels before they hit their eventual low for the cycle and begin moving back up. This also matches up with a higher inflationary environment as it would result in higher bond yields which in turn send bond prices lower.
I am using $TLT ( ▼ 0.02% ) as my vehicle and expect it to hit at least $88.50 before a true bottom is reached in bond prices.

Should that occur, I expect to see the 10-year yield pushing above 5%. Topping out somewhere in the 5%–5.35% range.

One thing I would absolutely not do: assume that any deal regarding the Strait of Hormuz will send oil and gas prices back to January/February levels, and I definitely would not assume such a deal automatically lifts stocks back to all-time highs.
A Bloomberg chart of the 1974 lifting of the oil embargo is instructive as stocks continued lower for months after the embargo ended. Relief in the headlines is not the same as relief in the economy.

Step 1: Wait for confirmation.
Whatever gets confirmed here is likely to last a few months, possibly into July. Meaning there is no rush to jump an entry.
Another possible outcome is that we simply jump right back into the range from October to March.
Either way, we’ll likely know shortly.
Sponsored by: Fisher Investments
What Will Your Retirement Look Like?

Retirement looks different for everyone. What it costs, where the income comes from, how long it needs to last. Those answers are specific to you.
The Definitive Guide to Retirement Income helps investors with $1,000,000 or more work through the questions that matter and build a plan around the answers.
Download your free guide to start turning a savings number into an actual retirement income strategy.
Click the Leave a comment button if you have any questions or comments, or need something clarified. Don’t be shy. The main point here is to improve constantly. Questions and comments help us both and tells me what you are interested in learning/hearing more about.
If you enjoyed this post or found it useful, do me a favor and hit the like (heart button all the way back to the top of the post and to the left) and share it with others.
Reply